Re: Where are we now
Posted: October 8th, 2022, 9:32 am
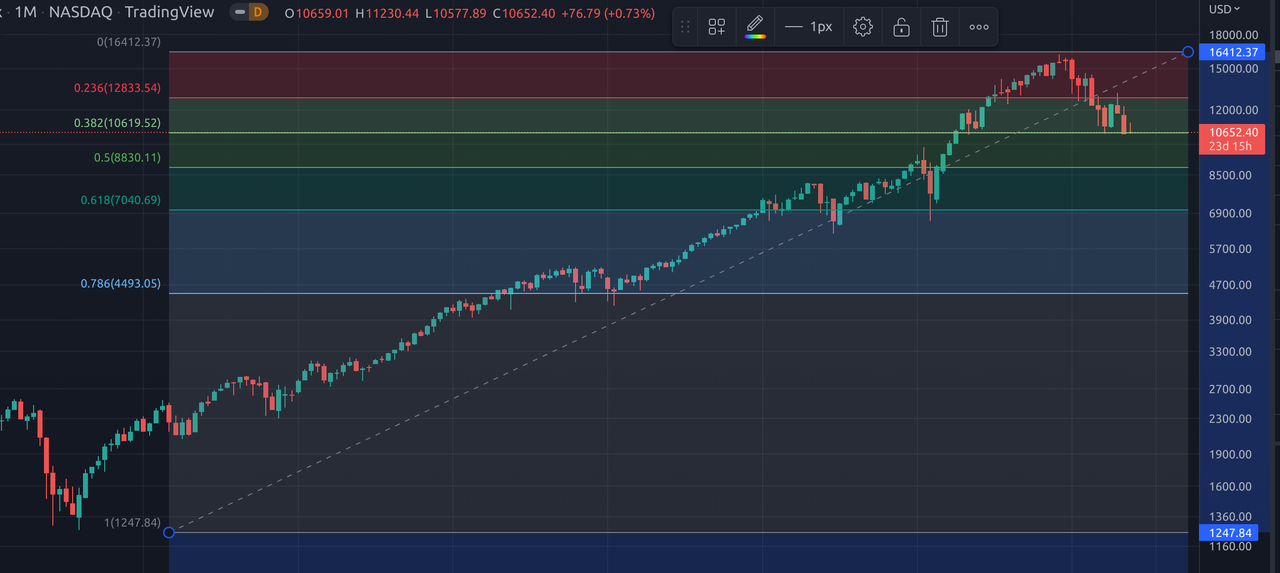
Well hopefully everyone agrees that we are in a well established downtrend now.
Looking more closely at the canary in the coalmine - Nasdaq - we are now testing the 10,600 level for the 3rd time, and if we get a break below the recent low then it would be a very bad sign. This is also roughly around where the 38% fib retracement from the 2009 lows sit. A decisive fail here would probably open the door to a downside target to the 50% retracement, around IXIC @ 8850. I personally feel that is very likely he way things are going.
Looking more closely at the canary in the coalmine - Nasdaq - we are now testing the 10,600 level for the 3rd time, and if we get a break below the recent low then it would be a very bad sign. This is also roughly around where the 38% fib retracement from the 2009 lows sit. A decisive fail here would probably open the door to a downside target to the 50% retracement, around IXIC @ 8850. I personally feel that is very likely he way things are going.