Over the years I've read lots on here around forever portfolio's, including the baskets of Investment trusts and it's inspired me to take a look my self. One of the things that occured to me is that the risk of failure is front loaded so you need a mechanism of some sort to potentially stave off bad market conditions at the start of retirement. I'm also a believer in KISS. To this end I've been researching portfolio's with two investments, with one being physical gold. What became apparent to me is that rebalancing just isn't worth it. With the data I have used you are in most cases worst off rebalancing and thats without considering costs.
This is what I propose for the portfolio upon inception:
50% invested in SGLN
50% invested in an Investment Trust/OIEC/ETF (or could be combinations which I haven't modelled yet)
Take income in equal proportions from each investment
Never rebalance
4% drawdown from capital per annum
First up VRWL a well known global tracker ETF:
sgln vrwl Income Capital
Year
2015 44112.00 46358.40 3769.60 90470.40
2016 55187.29 47588.20 4282.31 102775.48
2017 53340.06 56183.00 4563.46 109523.06
2018 52926.99 48207.71 4213.95 101134.71
2019 57735.31 58113.05 4827.01 115848.36
2020 65918.01 64151.23 5419.55 130069.24
2021 60863.95 72257.89 5546.74 133121.84
Starting capital: £100000
Income rate: 4%
No rebalancing Capital CAGR: 4.17%
No rebalancing Income CAGR: 4.78%
Total income received: £32622.62
Sure this only has 7 years of data but you can see increasing capital and income. Let try Law Debenture IT:
sgln lwdb Income Capital
Year
2012 47980.80 62856.00 4618.20 110836.80
2013 32058.85 76766.79 4534.40 108825.64
2014 32130.66 75258.47 4474.55 107389.14
2015 28346.96 69257.06 4066.83 97604.02
2016 35464.08 72523.78 4499.49 107987.86
2017 34277.03 84396.79 4944.74 118673.82
2018 34011.59 70844.69 4369.01 104856.28
2019 37101.47 84020.67 5046.76 121122.14
2020 42359.79 91121.43 5561.72 133481.22
2021 39111.98 104342.05 5977.25 143454.03
Starting capital: £100000
Income rate: 4%
No rebalancing Capital CAGR: 3.67%
No rebalancing Income CAGR: 4.10%
Total income received: £48092.95
Lets try Fundsmith:
sgln fundsmith Income Capital
Year
2012 47980.80 53520.00 4229.20 101500.80
2013 32058.85 63864.35 3996.80 95923.20
2014 32130.66 74981.85 4463.02 107112.51
2015 28346.96 82564.02 4621.29 110910.97
2016 35464.08 100820.57 5678.53 136284.65
2017 34277.03 117113.18 6307.93 151390.20
2018 34011.59 113777.79 6157.89 147789.38
2019 37101.47 136096.44 7216.58 173197.92
2020 42359.79 153255.48 8150.64 195615.27
2021 39111.98 178168.69 9053.36 217280.67
Starting capital: £100000
Income rate: 4%
No rebalancing Capital CAGR: 8.07%
No rebalancing Income CAGR: 8.51%
Total income received: £59875.24
Now that's tasty with minimal drawdown
What about racier, HG Capital Trust:
sgln hgt Income Capital
Year
2012 47980.80 50323.20 4096.00 98304.00
2013 32058.85 48498.68 3356.56 80557.53
2014 32130.66 50609.34 3447.50 82740.01
2015 28346.96 52267.71 3358.94 80614.67
2016 35464.08 71316.57 4449.19 106780.66
2017 34277.03 81013.35 4803.77 115290.38
2018 34011.59 79740.47 4739.67 113752.05
2019 37101.47 112124.02 6217.73 149225.50
2020 42359.79 131534.94 7245.61 173894.73
2021 39111.98 175267.67 8932.49 214379.65
Starting capital: £100000
Income rate: 4%
No rebalancing Capital CAGR: 7.92%
No rebalancing Income CAGR: 8.37%
Total income received: £50647.46
Fundsmith has been much superior.
Lets try SMT:
sgln smt Income Capital
Year
2012 47980.80 61944.00 4580.20 109924.80
2013 32058.85 82539.14 4774.92 114597.99
2014 32130.66 95370.35 5312.54 127501.01
2015 28346.96 102807.71 5464.78 131154.66
2016 35464.08 114032.66 6229.03 149496.75
2017 34277.03 153336.53 7817.23 187613.56
2018 34011.59 152546.54 7773.26 186558.13
2019 37101.47 181239.93 9097.56 218341.41
2020 42359.79 364492.36 16952.17 406852.15
2021 39111.98 383014.40 17588.60 422126.38
Starting capital: £100000
Income rate: 4%
No rebalancing Capital CAGR: 15.49%
No rebalancing Income CAGR: 15.96%
Total income received: £85590.29
Now that's unbelievably good, but has to be put into context that this year its currently around 40% down.
Food for thought?
Got a credit card? use our Credit Card & Finance Calculators
Thanks to Wasron,jfgw,Rhyd6,eyeball08,Wondergirly, for Donating to support the site
Forever Portfolios
-
TUK020
- Lemon Quarter
- Posts: 2046
- Joined: November 5th, 2016, 7:41 am
- Has thanked: 763 times
- Been thanked: 1179 times
Re: Forever Portfolios
So what struck me as strange, even if you don't rebalance, why take income from both equally?
Why not take income from whichever half is larger in value at the time?
Why not take income from whichever half is larger in value at the time?
-
JonnyT
- Lemon Pip
- Posts: 83
- Joined: November 7th, 2016, 8:54 am
- Has thanked: 11 times
- Been thanked: 27 times
Re: Forever Portfolios
Good question, but my thought is that as time passes you want more in equity not gold after the first few years risk dissipates.
-
EthicsGradient
- Lemon Slice
- Posts: 584
- Joined: March 1st, 2019, 11:33 am
- Has thanked: 33 times
- Been thanked: 235 times
Re: Forever Portfolios
For this to be a useful investigation, I think you'd also need to see what happens with starting years around a major drop, eg 2007 and 2008 (because you say the idea is to mitigate "bad market conditions at the start of retirement" ). If you can't get an ETC that goes back that far, then find quotes gold prices and use them (I presume the ETC should be tracking them anyway).
The idea of putting half in gold as a way of avoiding market problems seems to imply that before the start of retirement, all the fixed amount of money was in cash. For some people that may be true, but many will have had it in another form if they were investing for retirement (eg investments, or property either as buy-to-let or downsizing their own residence). The problem of risk of market timing occurs when you switch from one form (eg cash, or property) to another (eg investments or gold).
The idea of putting half in gold as a way of avoiding market problems seems to imply that before the start of retirement, all the fixed amount of money was in cash. For some people that may be true, but many will have had it in another form if they were investing for retirement (eg investments, or property either as buy-to-let or downsizing their own residence). The problem of risk of market timing occurs when you switch from one form (eg cash, or property) to another (eg investments or gold).
-
1nvest
- Lemon Quarter
- Posts: 4458
- Joined: May 31st, 2019, 7:55 pm
- Has thanked: 701 times
- Been thanked: 1374 times
Re: Forever Portfolios
If valuations were low (high interest rates), then all equities (home, stocks).
If valuations are high (low interest rates), then 67/33 equities/gold (maybe thirds each home/stocks/gold).
If high valuations become low valuations, then gold may do well, 67/33 -> 33/67. At that time sell up gold and buy 2 more homes, twice as many shares again to what you already hold.
If you don't rebalance and just let gold ride, and its 'insurance' is never called upon, then it will fade away, 67/33 -> 93/7, and you'll have time averaged 80/20 equity/gold ... and still have done OK.
All-stock and 3% SWR might see you end 30 years with around the same inflation adjusted start date amount still available at the end of the 30 years, or multiples of the inflation adjusted start date amount, perhaps 3x as much. Where the actual outcome is start/end date specific.
50/50 stock/gold and you're more inclined to end 30 years of 3% SWR with around the same as the inflation adjusted start date amount still available. But where along the way you might have had opportunities to sell gold to buy stock at low prices, ending 30 years with 3x multiples more final value.
From recent relatively high valuations/low interest rates, all-equity is more inclined to end with a 1.0 factor (multiple of inflation adjusted start date portfolio value after SWR withdrawals) than it is likely to end with a 3.0 factor, whilst a stock/gold stance there is a likely potential to at some point transition gold into stocks and end with a 3.0 factor rather than a 1.0 factor. Those that started back in the 1980's when interest rates were high, were better placed with all-equities, no gold, and have likely ended with multiples more from having done so. Forward 30 years from here is much less favourable for starting with all-equities.
Either way, thirds each home/stocks/gold and rebalancing ... or not, is potentially better than home/stocks alone. Generally not-rebalancing might be more preferred as selling down/adding to home value isn't really viable unless you mix in some liquid REIT holdings.
If not in drawdown, still accumulating, then forget gold, simple cost averaging to add more stock shares over time will tend to see you through OK, and only then add gold near/at retirement - if valuations at that time look high (low interest rates).
Way things are at present, and I can easily envisage a situation where house and stock prices could halve or more in real terms whilst gold doubled in real terms. When inflation is high, cash deposit interest rates are low, savers are guaranteed to lose out in real terms, so tend to withdraw their cash and buy gold (i.e. price of gold can spike when real yields are strongly negative). If/when interest rates have risen to 5%, so the tendency is for house and stock prices to decline, and declining prices along with high inflation can see overall real losses of 50%. If you start with 66% in combined stock/home value, 33% gold, but at some point transition to holding twice as much home/shares, 1.33 is better than 100% in combined home/stock and having seen that decline to 0.5.
Even at 25% gold, similar but less extreme outcome can arise. And 75/25 stock/gold on the basis that 50/50 stock/gold barbell combines to a central bullet - similar to how a barbell of 1 and 20 year gilts combine to a central 10 year bullet - might be considered as a form of 50/50 stock/bond allocation, but is more volatile. PV (US data)
For some 75/25 equities gold may mean 50% home, 25% equities, 25% gold. Supplement that with state/occupation/other pension that might be considered as being 'bonds'. For others it might mean 25% home, 50% stocks, 25% gold (plus pensions).
-
JonnyT
- Lemon Pip
- Posts: 83
- Joined: November 7th, 2016, 8:54 am
- Has thanked: 11 times
- Been thanked: 27 times
Re: Forever Portfolios
I only have data to 2012 would love some more.
However 2012 to 2014 also wasn't great for equities and gold also went down 29% in o e year
However 2012 to 2014 also wasn't great for equities and gold also went down 29% in o e year
-
vand
- Lemon Slice
- Posts: 758
- Joined: January 5th, 2022, 9:00 am
- Has thanked: 174 times
- Been thanked: 350 times
Re: Forever Portfolios
50% gold allocation is too high, but I have convincingly seen a good case put forward for as much as 35% allocation to replace bonds.
https://www.youtube.com/watch?v=DF7nrI0XWFY
https://www.youtube.com/watch?v=vAEUWvP0Fmo
The particularly interesting thing about this is his criticism of monte carlo/random walk which underpins much of what we supposedly know about SWRs.
https://www.youtube.com/watch?v=DF7nrI0XWFY
https://www.youtube.com/watch?v=vAEUWvP0Fmo
The particularly interesting thing about this is his criticism of monte carlo/random walk which underpins much of what we supposedly know about SWRs.
-
ursaminortaur
- Lemon Half
- Posts: 7074
- Joined: November 4th, 2016, 3:26 pm
- Has thanked: 456 times
- Been thanked: 1765 times
Re: Forever Portfolios
vand wrote:50% gold allocation is too high, but I have convincingly seen a good case put forward for as much as 35% allocation to replace bonds.
https://www.youtube.com/watch?v=DF7nrI0XWFY
https://www.youtube.com/watch?v=vAEUWvP0Fmo
The particularly interesting thing about this is his criticism of monte carlo/random walk which underpins much of what we supposedly know about SWRs.
The standard SWR rule, the 4% rule has nothing to do with Monte Carlo methods but instead was created by the back testing of portfolios using hstorical US stock markets from the early 1920s onwards.
-
1nvest
- Lemon Quarter
- Posts: 4458
- Joined: May 31st, 2019, 7:55 pm
- Has thanked: 701 times
- Been thanked: 1374 times
Re: Forever Portfolios
vand wrote:50% gold allocation is too high, but I have convincingly seen a good case put forward for as much as 35% allocation to replace bonds.
https://www.youtube.com/watch?v=DF7nrI0XWFY
https://www.youtube.com/watch?v=vAEUWvP0Fmo
The particularly interesting thing about this is his criticism of monte carlo/random walk which underpins much of what we supposedly know about SWRs.
Thanks for those video links
50/50 does (independently) maximise rebalance bonus
One interesting thingy:
Since that [0.01538] factor has nothing to do with your allocation (defined by x and y = 1-x), you'd get the largest "bonus" by
maximizing xy = x(1-x) ... and that occurs for x = y = 0.5
https://www.financialwebring.org/gummy- ... onus-2.htm
50/50 of primary fiat currency (US$) and non-fiat commodity currency (gold) is currency neutral.
However as those videos also suggest, two-thirds stock, one-third gold, or thereabouts is a good choice as historically fiat tended to win in around two thirds of time, non-fiat won in a third of time. Personally I view 50/50 stock/gold as being more of a barbell of two polar opposites that combine to a central bullet, somewhat like a currency unhedged global bond, in a similar vein to how 50/50 barbell of 1 and 20 year gilts combine to a central 10 year gilt bullet. So if 50/50 stock/gold is considered as 'bond-like' then 67/33 stock/gold might be considered as being 33/67 stock/bond like.
A common Bogleheads (who btw hate gold) suggestion is to lump in as soon as funds are available, but again there's conflict. In order to maximise withdrawal rate its actually better to time/average-in. Yes on average lumping in immediately yields a higher reward/outcome, but in the worst case is worse. SWR can be uplifted if you use timing/averaging-in. Another mistake is that the average outcome is more often measured as the simple average, not the median, such that infrequent outstanding outcome cases distort the broader average outcome figure.
The videos limited to 1970 for gold back test data, I think its reasonable however to use silver instead of gold and as such you can use data back to 1933 that way - when the US followed the UK's 1931 lead to disconnect from gold/money convertibility. Prior to 1930's it made more sense for investor to hold money, deposited to earn interest (T-Bills) as given fixed convertibility then interest was guaranteed to buy more ounces of gold if/when converted back to gold. In effect the state paid you for it to securely store your gold. In the UK case, where investment gold was still legal, you can use gold instead of silver. Comparing the two and as part of a 67/33 stock/gold (silver) portfolio compared close-enough.
With timing/averaging I measure a similar 6% SWR for both US and UK cases since the early 1930's. But where on average timing involved a average 2.5 years or so wait before averaging in. Somewhat Buffett style, let cash accumulate and only add that in when opportunities present rather than lumping in as soon as cash becomes available. 1.06^27.5 = 4.96 > 1.04^30 = 3.24. 4.96 / 3.24 = 1.53 ^ 0.033 = 1.4% annualised more over 30 years.
FT250/Gold/S&P500 thirds yearly rebalanced. Add in accumulated cash after the portfolio has a negative real prior year, adding half of the cash at the start of the year, half at the end of the year. i.e. avoids lumping in at a historic high, and averages in rather than lumps in to reduce the risk of having lumped all-in at the worst possible level.
Totally agree with the videos correlations observations. Bonds inverse correlate with stocks over the short term, correlate over the mid/longer term. Whilst gold tends to have a multi-year inverse correlation to stocks (gold inverse correlation to US$ whilst US stocks tend to correlate to US$).
SWR is of course a worst case historic measure, worst 30 year period withdrawal rate. If 6% is the worst, in the average case that's so much better, and in the best case(s) - fantastic results.
-
1nvest
- Lemon Quarter
- Posts: 4458
- Joined: May 31st, 2019, 7:55 pm
- Has thanked: 701 times
- Been thanked: 1374 times
Re: Forever Portfolios
vand wrote:50% gold allocation is too high, but I have convincingly seen a good case put forward for as much as 35% allocation to replace bonds.
https://www.youtube.com/watch?v=DF7nrI0XWFY
https://www.youtube.com/watch?v=vAEUWvP0Fmo
The particularly interesting thing about this is his criticism of monte carlo/random walk which underpins much of what we supposedly know about SWRs.
In the video there's a suggested 50% cash set aside, 65/35 non rebalanced stock/gold for 10 years whilst you spend that cash, rinse/repeat.
On average start with 33% stock, ends the decade with 67% stock, time averaging 50% stock. Starts with 17% gold, ends with 33% gold, time averages 25% gold. Starts with 50% cash, ends with 0% cash, time averages 25% cash. Rounding here to 67/33 stock/gold rather than the videos 65/35 suggested amounts, close enough to not make much of a difference.
Measuring yearly rebalanced constant weighted 50/25/25 stock/gold/cash, compared to 67/33 stock/gold, or shift the cash over to holding gold instead (50/50 stock/gold) and you can be looking at just 'noise' of differences PV (US data). A better choice of stock that is more evenly matched with gold is small cap value (UK's FT250 is a reasonable alternative to that). PV
If you own your own home, and have liquid assets perhaps of twice that house value split 50/50 between small cap value and gold, then that's land/stock/gold in equal measure - a asset allocation as suggested millennia ago by the Talmud. If the SCV stock are US then with a UK home that's domestic £, primary fiat reserve currency USD and global non-fiat currency (gold). Gold might also be considered as a proxy for a commodity index. Home + imputed might be considered as being similar to stocks + dividends, both might be classified as 'equities' such that thirds home/stock/gold = 67/33 equities/gold.
Supplemented with pensions that might be considered as being 'bonds' and as such 50/50 stock/gold liquid assets isn't necessarily 'too high' a gold allocation.
If you tally up each decades yearly best out of stock and gold real gains average, and worst assets average, i.e. a Callan table where you average the top row figures and bottom row figures, then those averages have been pretty consistent over many decades. The average of the yearly best being a decent real gain amount, the average of the worst tending to be a minor loss, near zero type average. Where in some decades it might be stocks that predominate the top row (yearly best), in other decades it can be more often gold. In effect 50/50 can be like holding one asset that generates a 10% average real, whilst the other asset averages a 0% real type average outcomes, combining to a 5% real overall outcome. In most years you can spend either stocks or gold, as one tends to be up, with some residual gains that can be sold to top up the other asset that is down. Not totally consistent, in some years both stocks and gold can be up, or down (but to different magnitudes). In cases when both are down one year, a adjacent year tends to see a correction, one up a lot as multi-year persistency of both fiat and non-fiat currencies and/or stock/gold both being down is very rare.
-
1nvest
- Lemon Quarter
- Posts: 4458
- Joined: May 31st, 2019, 7:55 pm
- Has thanked: 701 times
- Been thanked: 1374 times
Re: Forever Portfolios
Lowering SWR even a little can make a huge difference to outcome
For thirds each UK home (price only), US stock (total return after 15% US dividend withholding tax rate), Gold (T-Bills pre 1932), and relative to a yearly inflation rate of one third house prices, two thirds consumer prices, drawing a 2.6% 30 year SWR resulted in final portfolio value of around the same as the inflation adjusted start date portfolio value
That excludes imputed rent, that historically averaged 4.2%, so a 1.4% amount proportioned when a third of portfolio value. Which combined with 2.6% SWR totals a 4% overall effective SWR.
In the Trinity study 4% SWR identified the worst case where the portfolio value was all-spent at the end of 30 years, in the above a 4% SWR was a PWR (perpetual withdrawal rate).
But you can't rebalance easily/inexpensively every year to add/reduce to/from home value. You could use partial holdings of REIT's as a proxy for some of that value, or as per the earlier linked videos opt to rebalance less frequently, such as once each decade, or only when extreme deviations were apparent.
A combination of currencies (£ home, $ stocks, global currency gold) and assets (land, stocks, commodity).
That does mean liquid assets split 50/50 stock/gold, that many might consider way too much gold weighting, but if accompanied with pensions (annuity/bonds/state pension) might be considered as being more like 25% each in land/stocks/commodity/bonds. And reasonably liquid. Stocks can be liquidated in T+3 and shortly thereafter have that cash electronically transferred to anywhere in the world. As might gold if you hold 'paper gold' (gold fund), however physical gold does provide other certain benefits (a combination of both is nice, as paper gold is much easier/better to transport across international borders - unless you own a yacht or private jet). Land/home is the least liquid, so just something you might have to ride through with, come what may. If your portfolio value is large enough that might be diversified, UK main residence, another ... wherever else in the world. The way things are going Tenerife might be a nice second home location, very mild winters where you might spend Dec through Feb (mid 60's degrees daytime, 12 nighttime), and rent it out for other months when you're back in the UK. One bad aspect is the periodic sand/dust storms that blow out from the Sahara (dusty air for a few days each month during winter months).
Think about life issues - divorce, sued, death, £ sinking, gold collapsing/stocks soaring, stocks collapsing/gold soaring, single country geopolitical risk ...etc. and the diversity of currencies and assets is diverse enough to be 'comfortable'. Concentration risk is one, if not the greatest of risks.
Pretty much a ancient Talmud advocated choice - that also had safety utmost in mind (carry a third, bury/hide a third, third in merchandise). Some interpret that differently, such as bury a third in land being taken as owning some land/sowing some seeds and where gold coins was considered as being cash in hand at those times. Generally just another way of saying not to have all eggs in one basket. Solomon in contrast suggested proper diversification (in Ecclesiastes 11:2) to be
So maybe two homes, two main stock indexes, gold and silver ... for six, that supplemented with pensions being considered as 'bonds' makes seven.
For thirds each UK home (price only), US stock (total return after 15% US dividend withholding tax rate), Gold (T-Bills pre 1932), and relative to a yearly inflation rate of one third house prices, two thirds consumer prices, drawing a 2.6% 30 year SWR resulted in final portfolio value of around the same as the inflation adjusted start date portfolio value
That excludes imputed rent, that historically averaged 4.2%, so a 1.4% amount proportioned when a third of portfolio value. Which combined with 2.6% SWR totals a 4% overall effective SWR.
In the Trinity study 4% SWR identified the worst case where the portfolio value was all-spent at the end of 30 years, in the above a 4% SWR was a PWR (perpetual withdrawal rate).
But you can't rebalance easily/inexpensively every year to add/reduce to/from home value. You could use partial holdings of REIT's as a proxy for some of that value, or as per the earlier linked videos opt to rebalance less frequently, such as once each decade, or only when extreme deviations were apparent.
A combination of currencies (£ home, $ stocks, global currency gold) and assets (land, stocks, commodity).
That does mean liquid assets split 50/50 stock/gold, that many might consider way too much gold weighting, but if accompanied with pensions (annuity/bonds/state pension) might be considered as being more like 25% each in land/stocks/commodity/bonds. And reasonably liquid. Stocks can be liquidated in T+3 and shortly thereafter have that cash electronically transferred to anywhere in the world. As might gold if you hold 'paper gold' (gold fund), however physical gold does provide other certain benefits (a combination of both is nice, as paper gold is much easier/better to transport across international borders - unless you own a yacht or private jet). Land/home is the least liquid, so just something you might have to ride through with, come what may. If your portfolio value is large enough that might be diversified, UK main residence, another ... wherever else in the world. The way things are going Tenerife might be a nice second home location, very mild winters where you might spend Dec through Feb (mid 60's degrees daytime, 12 nighttime), and rent it out for other months when you're back in the UK. One bad aspect is the periodic sand/dust storms that blow out from the Sahara (dusty air for a few days each month during winter months).
Think about life issues - divorce, sued, death, £ sinking, gold collapsing/stocks soaring, stocks collapsing/gold soaring, single country geopolitical risk ...etc. and the diversity of currencies and assets is diverse enough to be 'comfortable'. Concentration risk is one, if not the greatest of risks.
Pretty much a ancient Talmud advocated choice - that also had safety utmost in mind (carry a third, bury/hide a third, third in merchandise). Some interpret that differently, such as bury a third in land being taken as owning some land/sowing some seeds and where gold coins was considered as being cash in hand at those times. Generally just another way of saying not to have all eggs in one basket. Solomon in contrast suggested proper diversification (in Ecclesiastes 11:2) to be
Divide your portion to seven, or even to eight, for you do not know what misfortune may occur on the earth.
So maybe two homes, two main stock indexes, gold and silver ... for six, that supplemented with pensions being considered as 'bonds' makes seven.
-
1nvest
- Lemon Quarter
- Posts: 4458
- Joined: May 31st, 2019, 7:55 pm
- Has thanked: 701 times
- Been thanked: 1374 times
Re: Forever Portfolios
JonnyT wrote:I only have data to 2012 would love some more.
All Pound adjusted with US stock total return after a assumed 15% dividend withholding tax rate, excluding costs/taxes.
Prior to 1932 investors wouldn't have been inclined to hold gold but instead have held cash deposits/T-Bills, as gold and money were convertible at a fixed rate so it was like the state paying you for it to securely store your gold.
-
1nvest
- Lemon Quarter
- Posts: 4458
- Joined: May 31st, 2019, 7:55 pm
- Has thanked: 701 times
- Been thanked: 1374 times
Re: Forever Portfolios
1nvest wrote:JonnyT wrote:I only have data to 2012 would love some more.
All Pound adjusted with US stock total return after a assumed 15% dividend withholding tax rate, excluding costs/taxes.
Prior to 1932 investors wouldn't have been inclined to hold gold but instead have held cash deposits/T-Bills, as gold and money were convertible at a fixed rate so it was like the state paying you for it to securely store your gold.
GoogleDocs copy
i.e. convert yearly values to inflation adjusted values so then we can draw a fixed percentage (SWR) such as 4% - which will also be inflation adjusted. Do that for every start year since 1932 for 30 year periods each and you have the overall outcomes distribution.
-
JonnyT
- Lemon Pip
- Posts: 83
- Joined: November 7th, 2016, 8:54 am
- Has thanked: 11 times
- Been thanked: 27 times
Re: Forever Portfolios
So portfolio's for 30 years with £100k start and 4% per annum drawdown.
50% Invested in Gold
50% Invested in US Stocks
Income taken 4% from each of Gold and Equity
Gold Equity Income Capital
Year
1932 38562.69 485765.83 289014.69 524328.53
1933 24584.96 497141.10 261944.16 521726.05
1934 23266.22 376491.04 236349.88 399757.27
1935 20935.36 594173.12 325823.05 615108.48
1936 20321.42 431103.53 243957.24 451424.95
1937 20571.02 364779.91 218383.77 385350.93
1938 20550.30 508815.54 339326.67 529365.85
1939 20509.33 513224.69 330346.58 533734.02
1940 23927.55 572986.85 328296.58 596914.40
1941 17478.99 497506.85 342847.76 514985.84
1942 19617.38 623810.74 443339.70 643428.12
1943 21523.52 558620.66 419142.74 580144.18
1944 34959.41 580635.27 388019.21 615594.68
1945 61302.56 413258.27 366376.37 474560.83
1946 98433.71 231629.45 299728.10 330063.16
1947 85806.36 422664.05 367844.06 508470.41
1948 97940.59 545560.47 400555.84 643501.06
1949 106745.35 399044.23 404908.21 505789.58
1950 137969.45 335758.31 360093.18 473727.76
1951 198487.42 205164.17 237296.85 403651.59
1952 213323.86 198941.84 231143.39 412265.69
1953 180571.10 202298.76 234055.41 382869.86
1954 241845.98 303347.49 261613.21 545193.47
1955 226243.02 278156.00 233918.48 504399.02
1956 226471.08 289673.40 230899.88 516144.48
1957 193954.51 273978.17 250929.11 467932.68
1958 227788.36 372480.55 294276.11 600268.90
1959 223205.09 206058.84 276595.91 429263.93
1960 196919.01 235911.21 296584.87 432830.22
1961 212157.97 306976.93 320877.90 519134.90
1962 171736.74 212542.50 325168.52 384279.24
1963 161307.38 298402.57 362157.59 459709.96
1964 188409.64 325981.83 370443.74 514391.46
1965 227116.15 320029.11 386550.02 547145.26
1966 210352.27 273770.36 408042.43 484122.63
1967 212684.80 400559.89 461324.58 613244.69
1968 184425.98 392645.05 474134.34 577071.03
1969 115924.90 412339.82 410275.41 528264.72
1970 136887.05 586773.72 527121.46 723660.77
1971 134032.54 688287.80 551133.70 822320.34
1972 125624.59 633433.75 563352.67 759058.34
1973 80312.24 447306.30 426733.17 527618.53
1974 51906.87 369815.96 413382.23 421722.83
1975 34011.24 552078.96 492673.59 586090.20
1976 37834.06 353496.89 377025.82 391330.94
1977 43693.31 310991.17 321467.16 354684.48
1978 43409.85 390882.39 404585.04 434292.24
1979 43749.79 373098.51 392093.12 416848.30
1980 30177.39 295808.80 362293.69 325986.19
1981 32020.93 290154.76 339565.07 322175.69
1982 50515.12 302825.28 329933.51 353340.40
1983 40812.29 200543.88 237353.12 241356.17
1984 45078.23 165732.49 201304.61 210810.72
1985 31822.60 159764.63 170079.46 191587.23
1986 39487.07 192038.69 189820.36 231525.76
1987 31098.63 160868.51 163513.92 191967.14
1988 41539.34 280619.12 222511.91 322158.46
1989 48135.92 253179.78 212219.28 301315.70
1990 46474.51 185665.17 177196.78 232139.68
1991 65399.99 295655.31 237806.88 361055.30
-
1nvest
- Lemon Quarter
- Posts: 4458
- Joined: May 31st, 2019, 7:55 pm
- Has thanked: 701 times
- Been thanked: 1374 times
Re: Forever Portfolios
I prefer inflation adjusted and a 30 year SWR measure, 4% of the start date portfolio value withdrawn at the start for first years spending, then each year uplift that £££ amount by inflation as the amount drawn at the start of subsequent years - for 30 years. A nice consistent inflation adjusted income.
For not rebalancing and taking equal amounts from stock and gold, with the exception of moving all of gold into stock if the % gold weighting had risen to 70% or more (end of years measure) [in some cases gold became exhausted so the 4% was obviously drawn from just stock] and I see a 100% success rate, with final inflation adjusted portfolio value as a multiple of start date portfolio value of ...
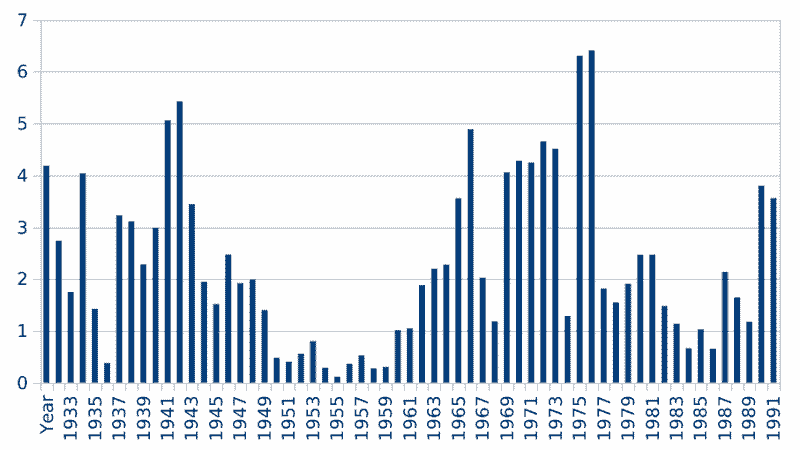
Sorting those ...
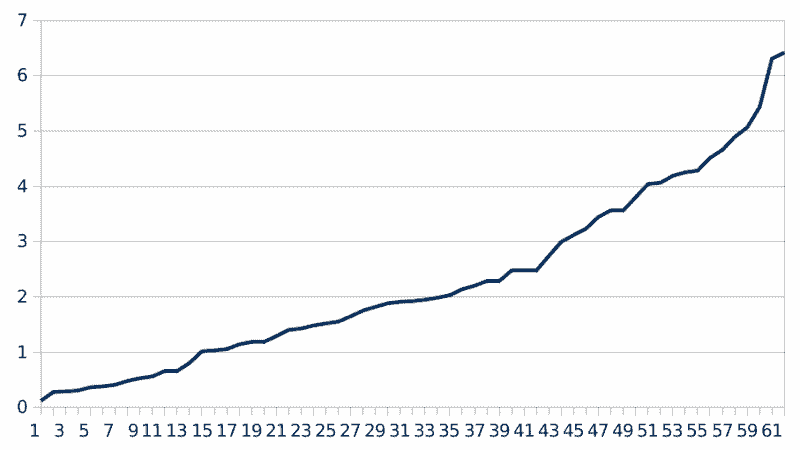
and the middle 'average' region indicates around twice the inflation adjusted start date portfolio value being available at the end of 30 years after 4% SWR. In the worst cases you ended with near nothing left, in the best cases you had over six times the inflation adjusted start date portfolio value available at the end of 30 years (after 4% SWR).
Note that without that 'exception' of moving gold into stock after gold weighting had risen to 70% or more, then there were four failure cases, ran out of money early. Generally clustered around the late 1960's start dates. I see that 'exception' as being the primary reason for holding gold, as a form of earlier years portfolio insurance. If called upon it historically served well, if not called upon and generally the weighting to gold tends to decline over time to near significant levels such that you start with 50/50 stock/gold and more or less end up with 100% stock, so time-average around 75/25 stock/gold overall.
1962 as a example and totally not rebalanced saw that end 30 years with 13% of the inflation adjusted start date portfolio value, but where in 1974 gold weighting had risen to being a little over 70% of the portfolio value, which was a great time to buy stocks. By dumping all of gold into stocks from 1975 that went on to end 30 years with more than 100% of the inflation adjusted start date portfolio value still available.
Not rebalancing, other than exceptional cases (such as gold weighting having risen to >70%) is nice in the sense that it makes holding physical gold more reasonable (higher spreads to otherwise trade/rebalance).
In all such studies you'll typically see times (intra 30 years) when the portfolio value can be significantly down, maybe to a third of its inflation adjusted start date level, so it does take some nerves to ride through such times, where the SWR withdrawal will seem like a sizeable amount relative to the ongoing portfolio value. Another option might be to take more during good times to set aside so that you can draw less during bad times.
For not rebalancing and taking equal amounts from stock and gold, with the exception of moving all of gold into stock if the % gold weighting had risen to 70% or more (end of years measure) [in some cases gold became exhausted so the 4% was obviously drawn from just stock] and I see a 100% success rate, with final inflation adjusted portfolio value as a multiple of start date portfolio value of ...
Sorting those ...
and the middle 'average' region indicates around twice the inflation adjusted start date portfolio value being available at the end of 30 years after 4% SWR. In the worst cases you ended with near nothing left, in the best cases you had over six times the inflation adjusted start date portfolio value available at the end of 30 years (after 4% SWR).
Note that without that 'exception' of moving gold into stock after gold weighting had risen to 70% or more, then there were four failure cases, ran out of money early. Generally clustered around the late 1960's start dates. I see that 'exception' as being the primary reason for holding gold, as a form of earlier years portfolio insurance. If called upon it historically served well, if not called upon and generally the weighting to gold tends to decline over time to near significant levels such that you start with 50/50 stock/gold and more or less end up with 100% stock, so time-average around 75/25 stock/gold overall.
1962 as a example and totally not rebalanced saw that end 30 years with 13% of the inflation adjusted start date portfolio value, but where in 1974 gold weighting had risen to being a little over 70% of the portfolio value, which was a great time to buy stocks. By dumping all of gold into stocks from 1975 that went on to end 30 years with more than 100% of the inflation adjusted start date portfolio value still available.
Not rebalancing, other than exceptional cases (such as gold weighting having risen to >70%) is nice in the sense that it makes holding physical gold more reasonable (higher spreads to otherwise trade/rebalance).
In all such studies you'll typically see times (intra 30 years) when the portfolio value can be significantly down, maybe to a third of its inflation adjusted start date level, so it does take some nerves to ride through such times, where the SWR withdrawal will seem like a sizeable amount relative to the ongoing portfolio value. Another option might be to take more during good times to set aside so that you can draw less during bad times.
-
1nvest
- Lemon Quarter
- Posts: 4458
- Joined: May 31st, 2019, 7:55 pm
- Has thanked: 701 times
- Been thanked: 1374 times
Re: Forever Portfolios
Too late to edit my prior post. Just another observation, since (including) 1998, there have been instances in ongoing runs where >70% gold weighting became apparent up to and including the 2007 start date years. Typically driven by 2009 and 2016 years. Basically 2009 was a stocks down (financial crisis) case, whilst 2016 was more of gold having done well case. Either way it automatically picked off good times to have migrated gold into stocks that most likely will yield good overall 30 year outcomes.
For all < 30 years (still running) cases (since 1992), each is doing well (ahead in real terms after 4% SWR's) with that 'exception' rule applied, strongly placed to likely 'succeed'.
For all < 30 years (still running) cases (since 1992), each is doing well (ahead in real terms after 4% SWR's) with that 'exception' rule applied, strongly placed to likely 'succeed'.
-
1nvest
- Lemon Quarter
- Posts: 4458
- Joined: May 31st, 2019, 7:55 pm
- Has thanked: 701 times
- Been thanked: 1374 times
Re: Forever Portfolios
EthicsGradient wrote:For this to be a useful investigation, I think you'd also need to see what happens with starting years around a major drop, eg 2007 and 2008 (because you say the idea is to mitigate "bad market conditions at the start of retirement" ). If you can't get an ETC that goes back that far, then find quotes gold prices and use them (I presume the ETC should be tracking them anyway).
The idea of putting half in gold as a way of avoiding market problems seems to imply that before the start of retirement, all the fixed amount of money was in cash. For some people that may be true, but many will have had it in another form if they were investing for retirement (eg investments, or property either as buy-to-let or downsizing their own residence). The problem of risk of market timing occurs when you switch from one form (eg cash, or property) to another (eg investments or gold).
Buy and hold is no different to the cost-less lumping in each and every day and as such could also be considered as 'timing' and be exposed to the same timing risk factor. But yes I agree that lumping in from one asset to another ... and IMO its better to half in at the start of year, other half at the end of year. Better the broad years average than having lumped all-in at the worst time. Mostly in this threads case its the gold side where that applies more. You may already be holding stocks so just reducing (but again selling in two shots can be better than a single shot (that might be the worst time to have sold)).
-
1nvest
- Lemon Quarter
- Posts: 4458
- Joined: May 31st, 2019, 7:55 pm
- Has thanked: 701 times
- Been thanked: 1374 times
Re: Forever Portfolios
JonnyT wrote:Over the years I've read lots on here around forever portfolio's, including the baskets of Investment trusts and it's inspired me to take a look my self. One of the things that occured to me is that the risk of failure is front loaded so you need a mechanism of some sort to potentially stave off bad market conditions at the start of retirement. I'm also a believer in KISS. To this end I've been researching portfolio's with two investments, with one being physical gold. What became apparent to me is that rebalancing just isn't worth it. With the data I have used you are in most cases worst off rebalancing and thats without considering costs.
This is what I propose for the portfolio upon inception:
50% invested in SGLN
50% invested in an Investment Trust/OIEC/ETF (or could be combinations which I haven't modelled yet)
Take income in equal proportions from each investment
Never rebalance
4% drawdown from capital per annum
First up VRWL a well known global tracker ETF:
sgln vrwl Income Capital
Year
2015 44112.00 46358.40 3769.60 90470.40
2016 55187.29 47588.20 4282.31 102775.48
2017 53340.06 56183.00 4563.46 109523.06
2018 52926.99 48207.71 4213.95 101134.71
2019 57735.31 58113.05 4827.01 115848.36
2020 65918.01 64151.23 5419.55 130069.24
2021 60863.95 72257.89 5546.74 133121.84
Starting capital: £100000
Income rate: 4%
No rebalancing Capital CAGR: 4.17%
No rebalancing Income CAGR: 4.78%
Total income received: £32622.62
Sure this only has 7 years of data but you can see increasing capital and income. Let try Law Debenture IT:
sgln lwdb Income Capital
Year
2012 47980.80 62856.00 4618.20 110836.80
2013 32058.85 76766.79 4534.40 108825.64
2014 32130.66 75258.47 4474.55 107389.14
2015 28346.96 69257.06 4066.83 97604.02
2016 35464.08 72523.78 4499.49 107987.86
2017 34277.03 84396.79 4944.74 118673.82
2018 34011.59 70844.69 4369.01 104856.28
2019 37101.47 84020.67 5046.76 121122.14
2020 42359.79 91121.43 5561.72 133481.22
2021 39111.98 104342.05 5977.25 143454.03
Starting capital: £100000
Income rate: 4%
No rebalancing Capital CAGR: 3.67%
No rebalancing Income CAGR: 4.10%
Total income received: £48092.95
Lets try Fundsmith:
sgln fundsmith Income Capital
Year
2012 47980.80 53520.00 4229.20 101500.80
2013 32058.85 63864.35 3996.80 95923.20
2014 32130.66 74981.85 4463.02 107112.51
2015 28346.96 82564.02 4621.29 110910.97
2016 35464.08 100820.57 5678.53 136284.65
2017 34277.03 117113.18 6307.93 151390.20
2018 34011.59 113777.79 6157.89 147789.38
2019 37101.47 136096.44 7216.58 173197.92
2020 42359.79 153255.48 8150.64 195615.27
2021 39111.98 178168.69 9053.36 217280.67
Starting capital: £100000
Income rate: 4%
No rebalancing Capital CAGR: 8.07%
No rebalancing Income CAGR: 8.51%
Total income received: £59875.24
Now that's tasty with minimal drawdown
What about racier, HG Capital Trust:
sgln hgt Income Capital
Year
2012 47980.80 50323.20 4096.00 98304.00
2013 32058.85 48498.68 3356.56 80557.53
2014 32130.66 50609.34 3447.50 82740.01
2015 28346.96 52267.71 3358.94 80614.67
2016 35464.08 71316.57 4449.19 106780.66
2017 34277.03 81013.35 4803.77 115290.38
2018 34011.59 79740.47 4739.67 113752.05
2019 37101.47 112124.02 6217.73 149225.50
2020 42359.79 131534.94 7245.61 173894.73
2021 39111.98 175267.67 8932.49 214379.65
Starting capital: £100000
Income rate: 4%
No rebalancing Capital CAGR: 7.92%
No rebalancing Income CAGR: 8.37%
Total income received: £50647.46
Fundsmith has been much superior.
Lets try SMT:
sgln smt Income Capital
Year
2012 47980.80 61944.00 4580.20 109924.80
2013 32058.85 82539.14 4774.92 114597.99
2014 32130.66 95370.35 5312.54 127501.01
2015 28346.96 102807.71 5464.78 131154.66
2016 35464.08 114032.66 6229.03 149496.75
2017 34277.03 153336.53 7817.23 187613.56
2018 34011.59 152546.54 7773.26 186558.13
2019 37101.47 181239.93 9097.56 218341.41
2020 42359.79 364492.36 16952.17 406852.15
2021 39111.98 383014.40 17588.60 422126.38
Starting capital: £100000
Income rate: 4%
No rebalancing Capital CAGR: 15.49%
No rebalancing Income CAGR: 15.96%
Total income received: £85590.29
Now that's unbelievably good, but has to be put into context that this year its currently around 40% down.
Food for thought?
Looking at SWR figures, £4K initial from £100K portfolio, uplifted by RPI each year https://www.ons.gov.uk/economy/inflatio ... /chaw/mm23 and your income streams have each risen faster/grown relative to SWR based withdrawals. If 4% was enough for you to retire, then a inflation adjusted uplift of that might still be 'enough', having more/growth on top might be superfluous to requirements.
Also if the portfolio value declines, then 4% of the ongoing portfolio value may become 'not enough'.
With SWR often you find that over time that might have become 2% or less of the ongoing portfolio value, very secure and more inclined to leave a substantial pot remaining at the end of 30 years ... or you can use discretion to draw/spend some of that, take a sizeable lump sum for instance out of 'obviously good gains' to lavish out with, or simply drop into a cash deposit account and be more thriftful with spending in general.
-
1nvest
- Lemon Quarter
- Posts: 4458
- Joined: May 31st, 2019, 7:55 pm
- Has thanked: 701 times
- Been thanked: 1374 times
Re: Forever Portfolios
For non-rebalanced 50/50 initial US stock/Gold, rotating into all-stock if the prior years end sees gold up at > 70% weighting, using a 3.33% 30 year SWR
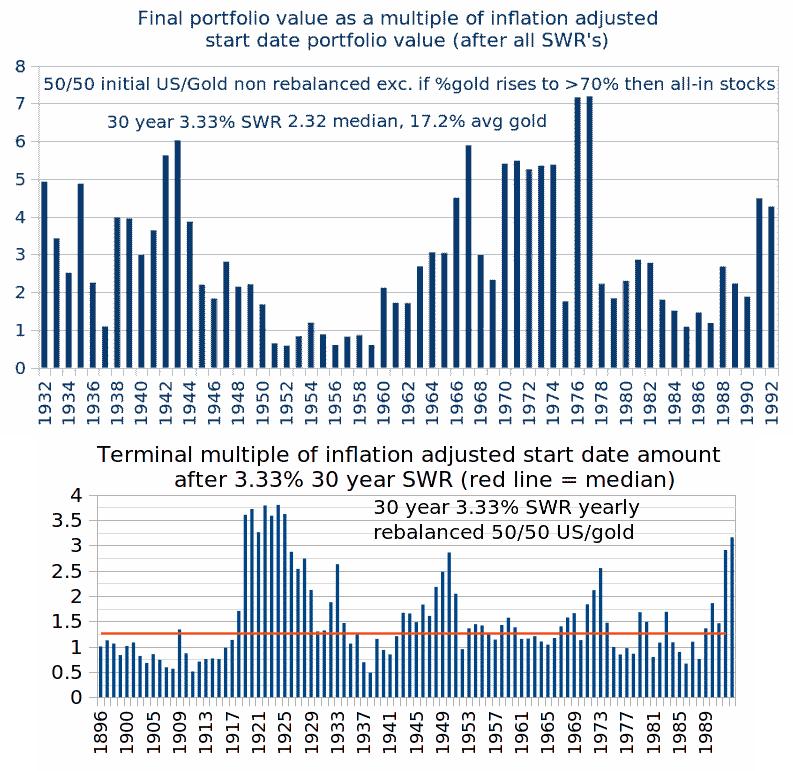
compared to 50/50 yearly rebalanced, and generally the risks were similar (similar worst case 30 year outcomes), but the non-rebalanced yielded a higher median (average) case outcome, typically averaging around 17% gold weighting overall. A form of averaging more into stocks over time, where earlier years bad sequence of returns risk is reduced, and there's less trading (costs) than yearly rebalancing.
Note that the second image was pulled out of my library of images and dates back to 1896 but where from 1896 to 1931 inclusive that held US stock/UK T-bills i.e. when gold was money then interest from the likes of T-Bills was like the state paying you for it to securely store your gold. That convertibility ended in 1931 (US 1933), after too much money was being converted to gold and the gold being removed from the country such that the Chancellor had to react (the actual Chancellor had a breakdown and the decision to decouple money from gold was actually taken by others).
-
1nvest
- Lemon Quarter
- Posts: 4458
- Joined: May 31st, 2019, 7:55 pm
- Has thanked: 701 times
- Been thanked: 1374 times
Re: Forever Portfolios
Comparing 30 year outcome 3.33% SWR charts of all stock (50/50 US/UK) and 50/50 non-rebalanced UK stock/gold (exc. if %gold rises to >70% where you go all-in on stock), and there's a -0.32 inverse correlation (Pearson) for data since 1932 (calendar yearly granularity) in final 30 year outcomes.
Fundamentally sometimes cost-averaging works out better, other times lumping in works out better and combining the above two lump/average in methods (50/50 weighted) is seemingly better than either alone. Similar worst case outcomes, but a more consistently better average case outcome.
Which when observed/aware, is quite obvious.
I suspect initial 50/50 UK/US stock lumped in ... and not rebalanced, would likely yield similar outcome to that of yearly rebalancing, so from a indolent perspective (not rebalancing) either the UK/US stock initial 50/50, and not rebalancing the initial 50/50 stock/gold portfolio (except if gold rises to a high percentage weighting), is pretty light on effort/trading. Most of the effort would be on withdrawal trading (SWR income provision/DIY dividends).
Return to “Retirement Investing (inc FIRE)”
Who is online
Users browsing this forum: No registered users and 31 guests