veeCodger1 wrote:I am about 10 years off retirement, and have had a HYP for about 15 years. I realise the main aim of a HYP is an annuity replacement, with hopefully rising dividend.
I notice my total returns from the HYP are very poor when compared to a world tracker. Obviously, we cannot predict what future returns will be.
It makes me think:
1. During the accumulation phase, that most people would be better off having a world tracker rather than a primarily UK based HYP.
2. In retirement, rather than having a HYP, income comes from drawdown of the world tracker. Some sort of safety margin, as is the case with a HYP, would be needed.
My understanding is that a passive world tracker (e.g. VWRL) usually outperforms a basket of ITs. I have not seen any research to show the opposite.
My understanding is that a HYP is more suited for a Doris type person who wants an annuity replacement.
Any comments please?
VC
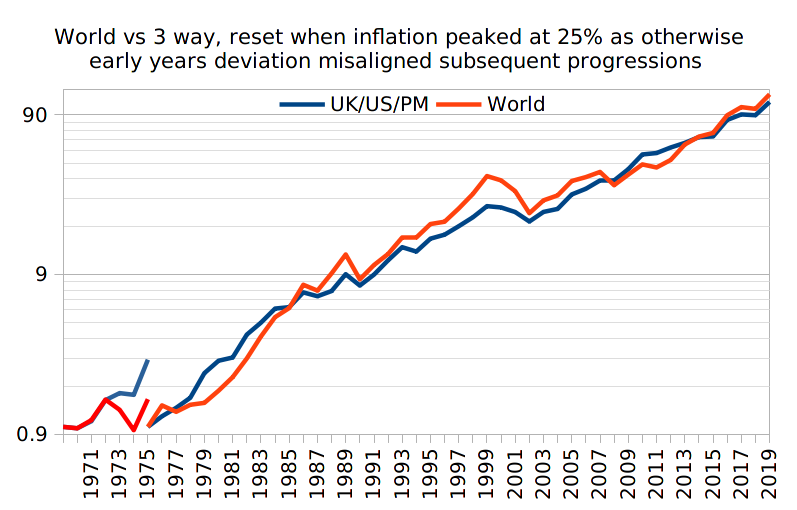
Berkshire Hathaway as a proxy for US, FT250 for UK, gold ... a third each. I like to benchmark that against Terry's TJH HYP accumulation ... i.e. total returns. Adding in MSCI World total returns and ...

MSCI world data from
viewtopic.php?p=336469#p336469The post I made immediately prior to that also shows some other comparisons .. FT100 for instance.
Terry rebalances/tweaks. The standard HYP doesn't. Broadly they might return similar overall total rewards but not rebalancing is risker, so same broad reward with more volatility (risk) is considered as a poorer risk adjusted reward. Running winners (not rebalancing) is nice, but leads to one or a few holdings becoming excessively weighted, so only nice having relatively more weighting in that/those until they turn around/down, at which point the higher weighting drags the whole portfolio down potentially heavily. So not rebalancing can pull ahead for a while, but then tends to dip back down again. Broadly might compare to rebalanced in reward, but at times maybe more, maybe less.
World took a larger hit during the dot com bubble burst 2003 type period ... because being weighted held relatively more exposure to dot com/US stock. 2009 financial crisis and World dipped less for UK investor as the Pound took quite a hit and holding US$ or other currencies helped reduced the losses from stocks. The UK being quite heavy into financials/banks was another factor.
Personally I like the diversity of some £ invested in FT250 which is small cap in US scale. Some US$ invested in US stocks, some gold (global currency and a commodity that can have multi-year inverse correlation to stocks i.e. do well when stocks do poorly). Broadly that has compared in reward to TJH HYP Accumulation, with less volatility along the way (better risk adjusted reward).
I prefer the SWR method of income production, taken out of total returns. For example with a 3% SWR you take 3% of the initial portfolio value as the first years income, and then increase that amount by inflation each year as the amount drawn in subsequent years. So a nice regular inflation adjusted income. Dividends in contrast can be volatile/variable.
My preference for holding BRK has seen that lag the broader S&P500 over recent times as dot com/tech stocks have been relatively high weightings in the S&P500 and have done very well. Had I held S&P500 instead then results would have been better. Over other periods it might/can swing the other way around - BRK for instance tends to drop less when the broader market falls.
Note that the above chart has calendar year data being compared against Terry's Fiscal year data. For fiscal year end 2021 (a few weeks time), and Terry's HYP has narrowed the gap right down again, i.e. tends to dip more, rebound strongly subsequently. Looking like being around 33% up for the fiscal year for instance, versus 16% for the 3-way.