HYP1 versus the baskets: 2000-21
Posted: November 20th, 2021, 12:55 pm
Here is a 21st year comparison of income delivery and capital performance, including volatility, between the inventor pyad's specimen High Yield Portfolio, HYP1, and income investment trusts. HYP1's results were reported by pyad on Nov. 17:
viewtopic.php?f=15&t=32154&start=40
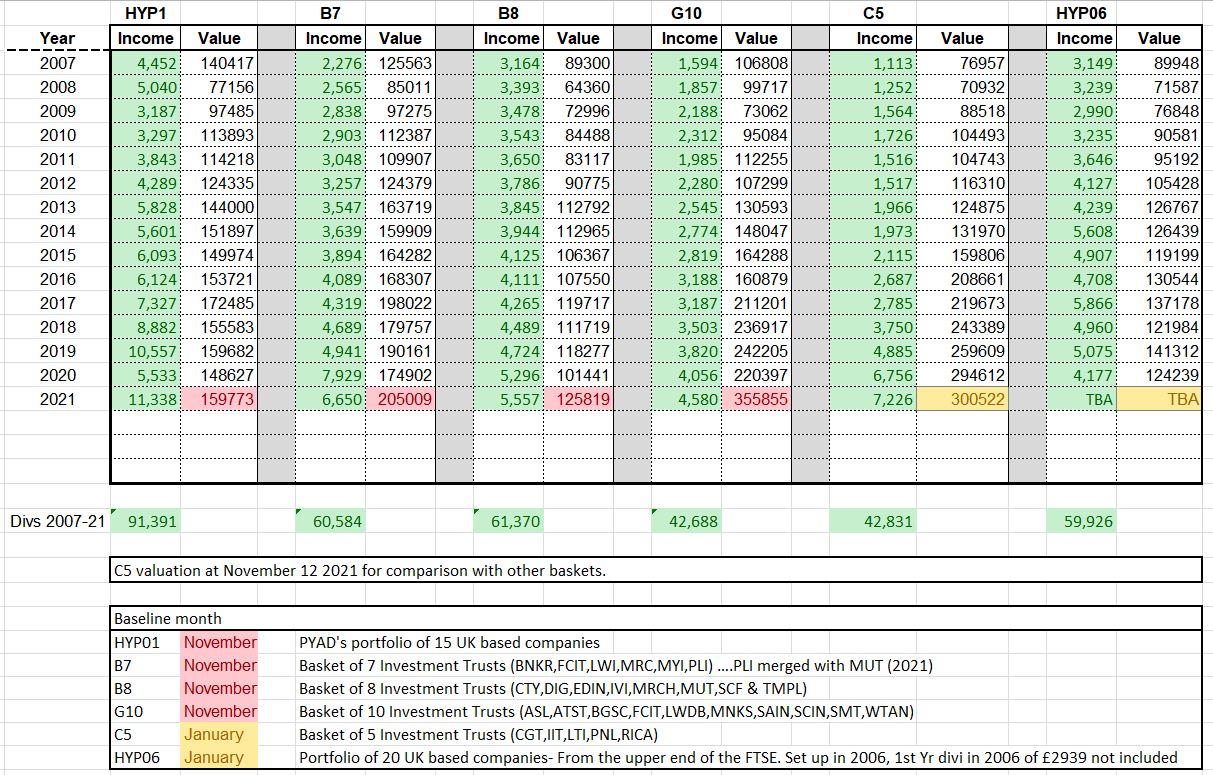
My alternatives are 'baskets' of seven (B7) or eight (B8) (1) investment trusts. These are tasked with the same objective as a High Yield Portfolio. All seek a sizeable, steadily growing and reasonably stable income from a lump sum, to supplement if not replace pensions on retiral. Voluntary 'tinkering' with the original components is deemed superfluous by your correspondent.
The B7 and B8 were selected in 2010 and back-calculated to HYP1's launch date on Nov. 12, 2000. To provide for hindsight bias (though any such would have dissipated after a decade's onward evolution) average outcomes are also shown for all larger UK Equity Income sector trusts available when HYP1 was launched: the 'Universe of 24' (U24) (2).
Three dividends payable by Dec. 31 are guesses pending declarations: ASEI 5.1p, (2020: 5.2p); BCI, 3.8p (3.75p); KPC, 20p (20p).
The assumption is that £75,000 gross was invested in equal amounts before 1% purchase expenses, without dividend reinvestment or capital additions. Compound annual growth rates (CAGR) are timed to eliminate random variations in dividend entitlements arising before Jan. 2002. Deflation is by the Retail Prices Index; inflation averaged 2.9% pa through the timespan. At the moment it is twice that. It is assumed Oct.'s unwonted 6.1%, the month's worst since 1990, will be Dec.'s as well.
INCOME
Totals for 2021 (£)...Change from 2020 (%)...Totals since launch (£)...CAGR 2002-21 (%)...Number of falls year-on-year (out of 19 changes, 2002-21)
HYP1: 11,339...+104.9...112,397...6.3...4
B7: 6,650...-16.1...93,757...5.2...3
B8: 5,557...+4.9...83,261...3.8...3
U24: 5,166...-6.7...80,026...3.2...2
HYP1's income had all but halved in 2019-20: the latest year resembles 2018-19 with large one-off distributions by Persimmon and Rio Tinto. Some post-pandemic restorations aided a record haul of more than £11,000.
The Basket of Seven is intended to grow income in real terms, but the trickle down from the period of cuts among companies, together with caution among trusts' own directorates-- most froze payouts or raised them below inflation-- brought about the B7's weakest annual collection. It shrank by almost a quarter in real terms.
The tally would have smelt much sweeter save for the distribution of PLI's revenue reserve when it was taken over at the end of 2020. Ignoring this prior-year windfall, the B7's year-on-year drop in income was below 1%. Nevertheless, HYP1 easily outran the B7 on any measure and has moved well ahead for lifelong growth: an income CAGR of 6.3% versus the B7's 5.2%.
The Basket of Eight was planned for shorter-term income-seekers, on a 'juicier' immediate yield. The concomitant was lower income growth potential. The B7's cumulative total delivery surpassed the B8's after eight years, and in 2021, impaired or not, will be £1,100 more.
Yet the B8 has been robust in the cuts crisis: its income grew by 4.9%, little less than inflation. Its long-term CAGR is still about one percentage point a year in real terms, against the Seven's 2+ points; but normally the B8 yields around a percentage point more on acquisition.
The 'Universe' takes in mavericks such as Nick Train's Finsbury, which lingers in the official UK Income sector despite a low yield; Securities Trust of Scotland and Aberdeen Diversified Income & Growth, with their mercurial policy shifts; and the family-dominated Brunner, which arguably should never have been included. These have been less able or willing to increase generous dividends steadily than vanilla trusts which, like HYP1, lean largely on British blue chips. The U24/22 houses two (then under the same management) which broke down, labouring for ever after to repair their payouts: Shires Income and Troy, the former Glasgow Investment Trust. Troy has 'reset' again, while Shires's dividend has shown little buoyancy.
Hence payouts from the Universe run below the B8's, besides always being more erratic. The benchmark's CAGR, from a depressed base in 2000, has dipped below the B8's.
In retrospect my winnowing of candidates for baskets 11 years ago was fairly prescient. Smoothness of delivery and freedom from decision-taking were sought then and have continued on the whole. Edinburgh's and Temple Bar's dividends were 'rebased' by new managers recently, but last spring's replacement of Invesco Income Growth by Aberdeen Standard Equity Income (2) did a lot to compensate-- ASEI joined the B8 on a highish yield.
All three optiosn mostly swelled their income streams in nominal (and mostly in real) terms year by year. HYP1 missed the mark four times out of 18, with an average dip of 24%. Trusts failed on this front only once or twice, and trivially so in baskets... before 2021. Then every member failed to deliver a rise matching presumed 6.1% inflation. That alerts income-seekers to the necessity of a revenue reserve, and for
DERISKING
Amount withdrawn (£)...Safety margin (%)...CAGR of withdrawn amount (%)...Average reserve, 2000-21 (months)...Reserve at end-2021 (months)...Average yield on capital (%) for amount withdrawn:
HYP1: 102,698..9...7.2...11...11...4.4
B7: 83,889...11...13.5..20...16...3.0
B8: 78,298...6...4.0...7...11...4.1
U24: 72,643...9...4.3...12...17...3.6
HYP1's superior revenue generation is the flip side of its waywardness. If income finances necessities, set part of your' receipts aside to safeguard purchasing power over time.
In hard times like these, your kitty will be belt to the trusts' braces, their revenue reserves: rainy-day earnings retained if current receipts come up short .Extra provision is needful if, as now, boards trumpet 'unbroken records' of dividend rises which do not keep up with the cost of living.
My way of building an income reserve is to fix a withdrawal rate once the first year's money is in the bank, somewhat below your total haul. Uplift the spendable portion by inflation annually and let the surplus accumulate until it shields you: ideally, 12 months' worth of whatever is the current amount being withdrawn. Thereafter you may have room now and then to withdraw more, but be wary.
'Derisking' income accumulates a margin of safety between received and spent. In my model of HYP1 it has averaged 9% of raw income; the CAGR for spendable income has been 7.2% against 6.3% from receipts. Thanks to the Rio Tinto/Persimmon boom-- and despite that unexpected post-lockdown inflation surge this autumn-- Year 21 is set to close with a reserve of 11 months' spendable. That is no less than the average throughout HYP1's life.
The baskets seem at least as well protected, with 16 months in reserve at the B7 and 11 at the B8. Investment trusts often say they have reshuffled their portfolios since Q1 2020 to make inflows more dependable. They assert that a benign reason why increases were some way below RPI was that juicy but wheezy old Value plodders, with tempting but dubious running yields, are being swapped out for 'growthier' shares selling on smaller starting yields. More dividend jam tomorrow? We shall see.
So what did these variances in policy and method, and holding back part of raw inflows, do for folks who want a stabilised running return from equities, not delight followed by dearth?
ANNUAL WITHDRAWAL YIELDS (%)
HYP1: Years 1-5: 3.5...6-16: 4.4...17,18: 5.3...19-21: 6.3
Time-weighted average: 4.5
Maximum reserve: 19 months (2019)
B7: Years 1-6: 2.5...7-11: 3.3...12-17: 4.1...18-21: 5.7
Time-weighted average: 3.8
Maximum reserve: 24 months (2012, 2017)
B8: Years 1-9: 3.3...10-21: 3.9
Time-weighted average: 3.6
Maximum reserve: 11 months (2020, 2021)
U24: Years 1-8: 3.0...9-14: 3.3...15-21: 3.8
Time-weighted average: 3.4
Maximum reserve: 18 months (2020)
The table above shows what set-asides could have meant for your pocket; how spendable income, as a yield on the £75,000 subscription, might have grown, if jacking up the abstraction was feasible without imperilling the reserve. All yields are RPI-index-linked, so rises boost purchasing power.
Fixing the withdrawal rate is art, not science, though in each case the starting withdrawal yield was at least as high as that of the All-Share Index at the time, honouring the H in HYP. Patterns reflect smoothness and size of the raw intake, and so are very mutable.
In conditions haunted by uncertainty, it would be rash to raise a withdrawal rate right now. Regarded as an indexed payer, without guarantees of capital maintenance but a sporting chance of profit if held long enough, the three options are viable. Just don't expect to cash in at any old moment without fear of a loss.
HYP1 kicked off on a 3.5% withdrawal rate, improved to 4.4% after six years. Until Year 17 inflow was too erratic to venture a higher rate that might come unstuck. The latter-day boom in divis until spring 2020 eased the dilemma: it would have permitted 5.3%+RPI for two years, and a point more from 2019. But it would be too bold to lift it to 4% or more. Too many imponderables.
The Basket of Seven could only offer 2.5%+RPI over its first six years, but buoyancy has allowed three rises (which lie behind its spendable CAGR of 13.5%). They took the rate to 5.7% by 2020.
The B8 could have paid a derisked 3.3% for the first nine years, 3.9% thereafter but with no more hikes in the past 12 years. Its stasis, compared with the B7, appears unlikely to be rectified if B8 trusts go on reposing confidence in dull FTSE 100 stocks. They are too fond of diverting their cash surpluses to buybacks and bolt-on acquisitions rather than giving the owners a sniff: Shell and SSE are egregious examples at this writing.
The time-weighted average withdrawal rate, calculated from the market value of the starting capital each Nov., descends from 4.5% for HYP1 to 3.4% for the Universe. HYP1 is sizeably ahead of the Basket of Seven, though with a thinner reserve; I have always found in tests that a bunch of high yielders will furnish more income even after safety measures.
Basket trusts are less disposed to shoot for elevated running yields because most except the juiciest, such as Merchants, also aim to pin down capital gains. For a High Yield Portfolio, that is not the principal goal, or in my case a goal at all.
Beyond such distinctions, remember the purpose of these portfolios: all would have given secure purchasing power, growing it at different speeds but all beat riskless but miserly cash deposits, wrestled to the canvas by central banks.
interest from cash or gilts latterly has been ~1% without indexing. The new 'green bond' has a 0.65% coupon and a three-year lockup. Index-linked annuities for single male retirees reflect stingy rewards from the government securities which underwrite them, quoted at under 3%+RPI: riskless but with capital forfeited.
Caveat: for those making a lump-sum investment, a 4% initial withdrawal rate, as was feasible with these 2000-vintage examples, may turn out too demanding. Inflation may notch up again while dividends are pegged to higher earnings or free cash flow cover than in the past two decades: directors reconsidering payout levels after the pandemic are fond of flaunting their prudence.
In 1950-80 inflation was 7.3%, in 1980-2021 under 3%. It has been suggested, in the context of Safe Withdrawal Rates for those contemplating drawdown of capital without eroding its real value, that a 3% SWR may be wiser than 4% henceforth. Similar caution may be advisable in derisking income, if only until more dust settles.
All the same, cavernous disparities between yields on asset types remain, and ordinary shares will retain charm if the principal originally committed is not eroded. Which brings us to
CAPITAL
Value at Nov. 12, 2020 (£)...Real change in year (%)...Real CAGR since launch (%)...Number of falls year-on-year (out of 21 changes, 2000-21)
HYP1: 159,773... +1.4...3.6...5
B7: 205,009...+11.1...4.9...7
B8: 125,819...+17.9...2.7...8
U24: 150,001...+10.6...3.4...7
-----------------------------------------------
FTSE 100: 7347.91...+9.8...0.8...8
FT All-Sh.: 4094.89...+11.4...1.6...8
Against 2.9% inflation, only the B8 has shed some of its original real worth, compounding at 2.7% pa. Most of the past two decades have seen it a smidgin ahead of inflation, however.
The Universe broke £150,000, doubling one's money, and the B7 £200,000. Both are all-time highs. HYP1 rose by 1.4%, below its lifetime average of 3.6%.
For the eternity investor the question is what valuations may predict for HYP1's dividends compared with basket revenues. Share prices are supposed to anticipate future earnings from a business. Is the B7's more spirited advance, notwithstanding its failure to grow purchasing power in 2020-21, discounting its repositioning towards more foreign and/or 'growthier' dividend streams?
Contrariwise, HYP1's anti-tinkering stance has left it very reliant on three or four constituents-- though not always the same ones-- for its income. (That said, my untinkered 'LuniHYPs' have never exhibited such pronounced biases, which I ascribe to a more mechanical discipline when reinvesting capital proceeds.)
The B7 is now worth one-third more than HYP1. Granted, other factors (gearing and discount control in the trusts, HYP1's stock selection in the past) can be adduced. The B8's modus operandi is closer to HYP1's, but despite overall sluggishness it has shown the best turn of speed for capital growth in the past year. Discounts have tautened, indicating that savers are as avid for immediate income as at any time since the Global Financial Crisis 10-13 years ago; but perhaps they want professional management with it. The IT trade body's 'dividend heroes' spiel is somewhat misleading but has struck a chord: probably the most successful marketing wheeze the industry ever pushed.
The High Yield Portfolio lost value, year/year, in five of 21 periods: fewer than the baskets, albeit HYP1's ups and downs, like its income's, were wider. But HYP1 has outperformed the B7 on capital only once since 2013, when HYP1's income nosedived in Year 20. Perhaps it was anticipating Year 21's upsurge in dividends, but not expecting it to follow through. Since the GFC the portfolio's relative weakness against the B7 may be to do with widespread forebodings about 'old economy' and 'mature' Footsie companies: qualms which have rendered the London stock market historically cheap and less and less important globally.
For the rest, I reiterate the doubts stated in last year's comparative review under 'Conclusions':
viewtopic.php?f=31&t=26279&p=357776#p357776
---------------------------------------------------------------------------------------------------------------------------
(1) Latest detailed annual reviews on the 'Investment Trusts and Unit Trusts' board:
B7:
viewtopic.php?f=54&t=28791&p=401947#p401947
B8:
None for year to June. Will try harder. Review for 2020 here:
viewtopic.php?f=54&t=25362&p=342370#p342370
(2) Now a U22. Murray Income Trust (MUT) absorbed Perpetual Income & Growth, but it is assumed that the share-swap option was exercised when the offer was closing. The Universe thus contains a double portion of MUT and of ASEI, which was substituted for Invesco Income Growth (IVI) last Apr.
Besides the fifteen, now thirteen, basket members, the others are Aberdeen Diversified Income and Growth (formerly BlackRock Income Strategies, previously British Assets) (ADIG); Brunner (BUT); Finsbury Growth & Income (FGT); Keystone Progressive Change (KPC, formerly KIT, see below); Scottish American Investment (SAIN); Securities Trust of Scotland (STS); Shires Income (SHRS); and Troy Income & Growth (TIGT).
Keystone was a UK Equity Income sector trust which sacked its manager, Invesco. It recruited Baillie Gifford to relaunch with a growth mandate plus trendy ESG trappings. KPC will no longer care about either the size or steadiness of dividends. My proposed replacement in the Universe will be Diverse Income Trust (DIVI), which does. The change will happen before KPC's new distribution policy comes into effect.
viewtopic.php?f=15&t=32154&start=40
My alternatives are 'baskets' of seven (B7) or eight (B8) (1) investment trusts. These are tasked with the same objective as a High Yield Portfolio. All seek a sizeable, steadily growing and reasonably stable income from a lump sum, to supplement if not replace pensions on retiral. Voluntary 'tinkering' with the original components is deemed superfluous by your correspondent.
The B7 and B8 were selected in 2010 and back-calculated to HYP1's launch date on Nov. 12, 2000. To provide for hindsight bias (though any such would have dissipated after a decade's onward evolution) average outcomes are also shown for all larger UK Equity Income sector trusts available when HYP1 was launched: the 'Universe of 24' (U24) (2).
Three dividends payable by Dec. 31 are guesses pending declarations: ASEI 5.1p, (2020: 5.2p); BCI, 3.8p (3.75p); KPC, 20p (20p).
The assumption is that £75,000 gross was invested in equal amounts before 1% purchase expenses, without dividend reinvestment or capital additions. Compound annual growth rates (CAGR) are timed to eliminate random variations in dividend entitlements arising before Jan. 2002. Deflation is by the Retail Prices Index; inflation averaged 2.9% pa through the timespan. At the moment it is twice that. It is assumed Oct.'s unwonted 6.1%, the month's worst since 1990, will be Dec.'s as well.
INCOME
Totals for 2021 (£)...Change from 2020 (%)...Totals since launch (£)...CAGR 2002-21 (%)...Number of falls year-on-year (out of 19 changes, 2002-21)
HYP1: 11,339...+104.9...112,397...6.3...4
B7: 6,650...-16.1...93,757...5.2...3
B8: 5,557...+4.9...83,261...3.8...3
U24: 5,166...-6.7...80,026...3.2...2
HYP1's income had all but halved in 2019-20: the latest year resembles 2018-19 with large one-off distributions by Persimmon and Rio Tinto. Some post-pandemic restorations aided a record haul of more than £11,000.
The Basket of Seven is intended to grow income in real terms, but the trickle down from the period of cuts among companies, together with caution among trusts' own directorates-- most froze payouts or raised them below inflation-- brought about the B7's weakest annual collection. It shrank by almost a quarter in real terms.
The tally would have smelt much sweeter save for the distribution of PLI's revenue reserve when it was taken over at the end of 2020. Ignoring this prior-year windfall, the B7's year-on-year drop in income was below 1%. Nevertheless, HYP1 easily outran the B7 on any measure and has moved well ahead for lifelong growth: an income CAGR of 6.3% versus the B7's 5.2%.
The Basket of Eight was planned for shorter-term income-seekers, on a 'juicier' immediate yield. The concomitant was lower income growth potential. The B7's cumulative total delivery surpassed the B8's after eight years, and in 2021, impaired or not, will be £1,100 more.
Yet the B8 has been robust in the cuts crisis: its income grew by 4.9%, little less than inflation. Its long-term CAGR is still about one percentage point a year in real terms, against the Seven's 2+ points; but normally the B8 yields around a percentage point more on acquisition.
The 'Universe' takes in mavericks such as Nick Train's Finsbury, which lingers in the official UK Income sector despite a low yield; Securities Trust of Scotland and Aberdeen Diversified Income & Growth, with their mercurial policy shifts; and the family-dominated Brunner, which arguably should never have been included. These have been less able or willing to increase generous dividends steadily than vanilla trusts which, like HYP1, lean largely on British blue chips. The U24/22 houses two (then under the same management) which broke down, labouring for ever after to repair their payouts: Shires Income and Troy, the former Glasgow Investment Trust. Troy has 'reset' again, while Shires's dividend has shown little buoyancy.
Hence payouts from the Universe run below the B8's, besides always being more erratic. The benchmark's CAGR, from a depressed base in 2000, has dipped below the B8's.
In retrospect my winnowing of candidates for baskets 11 years ago was fairly prescient. Smoothness of delivery and freedom from decision-taking were sought then and have continued on the whole. Edinburgh's and Temple Bar's dividends were 'rebased' by new managers recently, but last spring's replacement of Invesco Income Growth by Aberdeen Standard Equity Income (2) did a lot to compensate-- ASEI joined the B8 on a highish yield.
All three optiosn mostly swelled their income streams in nominal (and mostly in real) terms year by year. HYP1 missed the mark four times out of 18, with an average dip of 24%. Trusts failed on this front only once or twice, and trivially so in baskets... before 2021. Then every member failed to deliver a rise matching presumed 6.1% inflation. That alerts income-seekers to the necessity of a revenue reserve, and for
DERISKING
Amount withdrawn (£)...Safety margin (%)...CAGR of withdrawn amount (%)...Average reserve, 2000-21 (months)...Reserve at end-2021 (months)...Average yield on capital (%) for amount withdrawn:
HYP1: 102,698..9...7.2...11...11...4.4
B7: 83,889...11...13.5..20...16...3.0
B8: 78,298...6...4.0...7...11...4.1
U24: 72,643...9...4.3...12...17...3.6
HYP1's superior revenue generation is the flip side of its waywardness. If income finances necessities, set part of your' receipts aside to safeguard purchasing power over time.
In hard times like these, your kitty will be belt to the trusts' braces, their revenue reserves: rainy-day earnings retained if current receipts come up short .Extra provision is needful if, as now, boards trumpet 'unbroken records' of dividend rises which do not keep up with the cost of living.
My way of building an income reserve is to fix a withdrawal rate once the first year's money is in the bank, somewhat below your total haul. Uplift the spendable portion by inflation annually and let the surplus accumulate until it shields you: ideally, 12 months' worth of whatever is the current amount being withdrawn. Thereafter you may have room now and then to withdraw more, but be wary.
'Derisking' income accumulates a margin of safety between received and spent. In my model of HYP1 it has averaged 9% of raw income; the CAGR for spendable income has been 7.2% against 6.3% from receipts. Thanks to the Rio Tinto/Persimmon boom-- and despite that unexpected post-lockdown inflation surge this autumn-- Year 21 is set to close with a reserve of 11 months' spendable. That is no less than the average throughout HYP1's life.
The baskets seem at least as well protected, with 16 months in reserve at the B7 and 11 at the B8. Investment trusts often say they have reshuffled their portfolios since Q1 2020 to make inflows more dependable. They assert that a benign reason why increases were some way below RPI was that juicy but wheezy old Value plodders, with tempting but dubious running yields, are being swapped out for 'growthier' shares selling on smaller starting yields. More dividend jam tomorrow? We shall see.
So what did these variances in policy and method, and holding back part of raw inflows, do for folks who want a stabilised running return from equities, not delight followed by dearth?
ANNUAL WITHDRAWAL YIELDS (%)
HYP1: Years 1-5: 3.5...6-16: 4.4...17,18: 5.3...19-21: 6.3
Time-weighted average: 4.5
Maximum reserve: 19 months (2019)
B7: Years 1-6: 2.5...7-11: 3.3...12-17: 4.1...18-21: 5.7
Time-weighted average: 3.8
Maximum reserve: 24 months (2012, 2017)
B8: Years 1-9: 3.3...10-21: 3.9
Time-weighted average: 3.6
Maximum reserve: 11 months (2020, 2021)
U24: Years 1-8: 3.0...9-14: 3.3...15-21: 3.8
Time-weighted average: 3.4
Maximum reserve: 18 months (2020)
The table above shows what set-asides could have meant for your pocket; how spendable income, as a yield on the £75,000 subscription, might have grown, if jacking up the abstraction was feasible without imperilling the reserve. All yields are RPI-index-linked, so rises boost purchasing power.
Fixing the withdrawal rate is art, not science, though in each case the starting withdrawal yield was at least as high as that of the All-Share Index at the time, honouring the H in HYP. Patterns reflect smoothness and size of the raw intake, and so are very mutable.
In conditions haunted by uncertainty, it would be rash to raise a withdrawal rate right now. Regarded as an indexed payer, without guarantees of capital maintenance but a sporting chance of profit if held long enough, the three options are viable. Just don't expect to cash in at any old moment without fear of a loss.
HYP1 kicked off on a 3.5% withdrawal rate, improved to 4.4% after six years. Until Year 17 inflow was too erratic to venture a higher rate that might come unstuck. The latter-day boom in divis until spring 2020 eased the dilemma: it would have permitted 5.3%+RPI for two years, and a point more from 2019. But it would be too bold to lift it to 4% or more. Too many imponderables.
The Basket of Seven could only offer 2.5%+RPI over its first six years, but buoyancy has allowed three rises (which lie behind its spendable CAGR of 13.5%). They took the rate to 5.7% by 2020.
The B8 could have paid a derisked 3.3% for the first nine years, 3.9% thereafter but with no more hikes in the past 12 years. Its stasis, compared with the B7, appears unlikely to be rectified if B8 trusts go on reposing confidence in dull FTSE 100 stocks. They are too fond of diverting their cash surpluses to buybacks and bolt-on acquisitions rather than giving the owners a sniff: Shell and SSE are egregious examples at this writing.
The time-weighted average withdrawal rate, calculated from the market value of the starting capital each Nov., descends from 4.5% for HYP1 to 3.4% for the Universe. HYP1 is sizeably ahead of the Basket of Seven, though with a thinner reserve; I have always found in tests that a bunch of high yielders will furnish more income even after safety measures.
Basket trusts are less disposed to shoot for elevated running yields because most except the juiciest, such as Merchants, also aim to pin down capital gains. For a High Yield Portfolio, that is not the principal goal, or in my case a goal at all.
Beyond such distinctions, remember the purpose of these portfolios: all would have given secure purchasing power, growing it at different speeds but all beat riskless but miserly cash deposits, wrestled to the canvas by central banks.
interest from cash or gilts latterly has been ~1% without indexing. The new 'green bond' has a 0.65% coupon and a three-year lockup. Index-linked annuities for single male retirees reflect stingy rewards from the government securities which underwrite them, quoted at under 3%+RPI: riskless but with capital forfeited.
Caveat: for those making a lump-sum investment, a 4% initial withdrawal rate, as was feasible with these 2000-vintage examples, may turn out too demanding. Inflation may notch up again while dividends are pegged to higher earnings or free cash flow cover than in the past two decades: directors reconsidering payout levels after the pandemic are fond of flaunting their prudence.
In 1950-80 inflation was 7.3%, in 1980-2021 under 3%. It has been suggested, in the context of Safe Withdrawal Rates for those contemplating drawdown of capital without eroding its real value, that a 3% SWR may be wiser than 4% henceforth. Similar caution may be advisable in derisking income, if only until more dust settles.
All the same, cavernous disparities between yields on asset types remain, and ordinary shares will retain charm if the principal originally committed is not eroded. Which brings us to
CAPITAL
Value at Nov. 12, 2020 (£)...Real change in year (%)...Real CAGR since launch (%)...Number of falls year-on-year (out of 21 changes, 2000-21)
HYP1: 159,773... +1.4...3.6...5
B7: 205,009...+11.1...4.9...7
B8: 125,819...+17.9...2.7...8
U24: 150,001...+10.6...3.4...7
-----------------------------------------------
FTSE 100: 7347.91...+9.8...0.8...8
FT All-Sh.: 4094.89...+11.4...1.6...8
Against 2.9% inflation, only the B8 has shed some of its original real worth, compounding at 2.7% pa. Most of the past two decades have seen it a smidgin ahead of inflation, however.
The Universe broke £150,000, doubling one's money, and the B7 £200,000. Both are all-time highs. HYP1 rose by 1.4%, below its lifetime average of 3.6%.
For the eternity investor the question is what valuations may predict for HYP1's dividends compared with basket revenues. Share prices are supposed to anticipate future earnings from a business. Is the B7's more spirited advance, notwithstanding its failure to grow purchasing power in 2020-21, discounting its repositioning towards more foreign and/or 'growthier' dividend streams?
Contrariwise, HYP1's anti-tinkering stance has left it very reliant on three or four constituents-- though not always the same ones-- for its income. (That said, my untinkered 'LuniHYPs' have never exhibited such pronounced biases, which I ascribe to a more mechanical discipline when reinvesting capital proceeds.)
The B7 is now worth one-third more than HYP1. Granted, other factors (gearing and discount control in the trusts, HYP1's stock selection in the past) can be adduced. The B8's modus operandi is closer to HYP1's, but despite overall sluggishness it has shown the best turn of speed for capital growth in the past year. Discounts have tautened, indicating that savers are as avid for immediate income as at any time since the Global Financial Crisis 10-13 years ago; but perhaps they want professional management with it. The IT trade body's 'dividend heroes' spiel is somewhat misleading but has struck a chord: probably the most successful marketing wheeze the industry ever pushed.
The High Yield Portfolio lost value, year/year, in five of 21 periods: fewer than the baskets, albeit HYP1's ups and downs, like its income's, were wider. But HYP1 has outperformed the B7 on capital only once since 2013, when HYP1's income nosedived in Year 20. Perhaps it was anticipating Year 21's upsurge in dividends, but not expecting it to follow through. Since the GFC the portfolio's relative weakness against the B7 may be to do with widespread forebodings about 'old economy' and 'mature' Footsie companies: qualms which have rendered the London stock market historically cheap and less and less important globally.
For the rest, I reiterate the doubts stated in last year's comparative review under 'Conclusions':
viewtopic.php?f=31&t=26279&p=357776#p357776
---------------------------------------------------------------------------------------------------------------------------
(1) Latest detailed annual reviews on the 'Investment Trusts and Unit Trusts' board:
B7:
viewtopic.php?f=54&t=28791&p=401947#p401947
B8:
None for year to June. Will try harder. Review for 2020 here:
viewtopic.php?f=54&t=25362&p=342370#p342370
(2) Now a U22. Murray Income Trust (MUT) absorbed Perpetual Income & Growth, but it is assumed that the share-swap option was exercised when the offer was closing. The Universe thus contains a double portion of MUT and of ASEI, which was substituted for Invesco Income Growth (IVI) last Apr.
Besides the fifteen, now thirteen, basket members, the others are Aberdeen Diversified Income and Growth (formerly BlackRock Income Strategies, previously British Assets) (ADIG); Brunner (BUT); Finsbury Growth & Income (FGT); Keystone Progressive Change (KPC, formerly KIT, see below); Scottish American Investment (SAIN); Securities Trust of Scotland (STS); Shires Income (SHRS); and Troy Income & Growth (TIGT).
Keystone was a UK Equity Income sector trust which sacked its manager, Invesco. It recruited Baillie Gifford to relaunch with a growth mandate plus trendy ESG trappings. KPC will no longer care about either the size or steadiness of dividends. My proposed replacement in the Universe will be Diverse Income Trust (DIVI), which does. The change will happen before KPC's new distribution policy comes into effect.