It should be an interesting day tomorrow, Monday 20 September. So far as I can see, the FTSE 100 has been in a trading range 6800 to 7200 since last March, with a rising 200 dma. However, I haven’t seen any sign of a serious attempt to break above 7200 - as to which, please see a one year chart with 20, 50 and 200 dmas: https://bigcharts.marketwatch.com/advch ... e&state=11
At 6963.64 the FTSE is trading below its 50 dma and hovering above the 200 dma, which is above 6800. So any significant breach of the 6800 might suggest a period of weakness, as already indicated by the RSI and MACD.
I’m also noting the three year chart showing the context of the current market – i.e. heading into admittedly historical resistance: https://bigcharts.marketwatch.com/advch ... e&state=11
Lastly, The P&F IFL [proxy] chart is described as a ‘Double Bottom Breakdown’ on 17 September : https://stockcharts.com/freecharts/pnf.php?c=ISF.L,P
I see no reason to commit any of my carefully hoarded cash to the market. But this post could be embarrassingly wrong… (So DYOR and E&OE, as ever).
ATB
Jon
Got a credit card? use our Credit Card & Finance Calculators
Thanks to Anonymous,bruncher,niord,gvonge,Shelford, for Donating to support the site
Where are we now
-
Jonetc15
- Lemon Slice
- Posts: 464
- Joined: November 4th, 2016, 3:27 pm
- Has thanked: 275 times
- Been thanked: 44 times
Re: Where are we now
Reassuring bounce off the 200 dma (as at 10:15 this morning). Watching the market far more closely than usual. No idea what will happen at what seems to be a major point technically.
Jon
Jon
-
Jonetc15
- Lemon Slice
- Posts: 464
- Joined: November 4th, 2016, 3:27 pm
- Has thanked: 275 times
- Been thanked: 44 times
Re: Where are we now
Yesterday's (Tuesday 21) pattern on the FTSE 100 P&F chart is described as a 'Low Pole Reversal' - see: https://stockcharts.com/freecharts/pnf.php?c=ISF.L,P
For a definition/explanation, see: https://school.stockcharts.com/doku.php ... pnf_alerts
For copyright reasons I'm only quoting part of one explanation (scrolling down to the end of the page):
"The low pole reversal is seen when a chart falls below a previous low by at least 3 boxes, before reversing to rise by at least 50 percent of the fall. The reversal implies that the supply that was making the prices fall has been absorbed and demand is taking over. [etc]..."
For other definitions see (e.g.) https://duckduckgo.com/?q=low+pole+reve ... 1-1&ia=web
The market is dithering, at least as I see it. (DYOR and E&OE)
Jon
-
Jonetc15
- Lemon Slice
- Posts: 464
- Joined: November 4th, 2016, 3:27 pm
- Has thanked: 275 times
- Been thanked: 44 times
Re: Where are we now
A thought-provoking article. For copyright reasons the extracts below are simply to encourage people to read it.
Retail investors riding the bull market could spur a populist backlash - https://worldnewsera.com/news/finance/r ... -backlash/
“Arguably, the bull market of 2021 is the same one that started in 2009, with one big change. Retail investors, who sat on the sidelines for so many years, rushed in after the pandemic-induced flash crash last year and have since been buying every dip with mounting enthusiasm. They represent not only a new cohort of investors but a new voting bloc, increasing the risk of populist backlash should one of the dips turn into another bear market….
….But many retail investors are placing their bets in a highly speculative way, for example by buying one-day call options or stocks with low nominal value that are easy to lever up….
….None of this necessarily portends an imminent crash. There is still plenty of liquidity sloshing around the system and even some of the most sophisticated investors fret that there is no alternative to owning stocks with interest rates so low. But having done so much to inspire this retail investor mania, governments and central banks could face a major backlash when the next bear market inevitably arrives.”
Jon
-
Jonetc15
- Lemon Slice
- Posts: 464
- Joined: November 4th, 2016, 3:27 pm
- Has thanked: 275 times
- Been thanked: 44 times
Re: Where are we now
'Triple Top Breakout' for the ISF.L proxy for FTSE 100 on 24-Dec-2021: https://stockcharts.com/freecharts/pnf.php?c=ISF.L,P
Here's the FTSE 100 one-year chart: https://bigcharts.marketwatch.com/advch ... e&state=11
And the three-year: https://bigcharts.marketwatch.com/advch ... e&state=11
Food for thought...
Jon
(E&OE)
Here's the FTSE 100 one-year chart: https://bigcharts.marketwatch.com/advch ... e&state=11
And the three-year: https://bigcharts.marketwatch.com/advch ... e&state=11
Food for thought...
Jon
(E&OE)
-
BT63
- Lemon Slice
- Posts: 432
- Joined: November 5th, 2016, 1:22 pm
- Has thanked: 59 times
- Been thanked: 121 times
Re: Where are we now
Jonetc15 wrote:'Triple Top Breakout' for the ISF.L proxy for FTSE 100 on 24-Dec-2021: https://stockcharts.com/freecharts/pnf.php?c=ISF.L,P
Here's the FTSE 100 one-year chart: https://bigcharts.marketwatch.com/advch ... e&state=11
And the three-year: https://bigcharts.marketwatch.com/advch ... e&state=11
Food for thought...
Jon
(E&OE)
How reliable is a breakout in the quirky, low-volume Christmas trading?
I seem to recall that the FTSE made what was then an all-time high (6930pts) on the last trading day of 1999 in light trade, and by the end of the first week of January 2000 it had fallen 7%, falling further to reach a 13% decline by mid-February.
-
GoSeigen
- Lemon Quarter
- Posts: 4488
- Joined: November 8th, 2016, 11:14 pm
- Has thanked: 1628 times
- Been thanked: 1627 times
Re: Where are we now
Jonetc15 wrote:'Triple Top Breakout' for the ISF.L proxy for FTSE 100 on 24-Dec-2021: https://stockcharts.com/freecharts/pnf.php?c=ISF.L,P
I agree, very bullish this, especially at the FTSE is pretty close to new all-time highs as well. I've closed all my short calls in the recent consolidation, think it might be a good time to write puts again...
GS
-
Jonetc15
- Lemon Slice
- Posts: 464
- Joined: November 4th, 2016, 3:27 pm
- Has thanked: 275 times
- Been thanked: 44 times
Re: Where are we now
GoSeigen wrote:Jonetc15 wrote:'Triple Top Breakout' for the ISF.L proxy for FTSE 100 on 24-Dec-2021: https://stockcharts.com/freecharts/pnf.php?c=ISF.L,P
I agree, very bullish this, especially at the FTSE is pretty close to new all-time highs as well. I've closed all my short calls in the recent consolidation, think it might be a good time to write puts again...
GS
Good to have replies from BT63 and you, GS.
I have to say that I was slightly cautious in saying 'Food for thought...' rather than suggesting that the charts are 'very bullish'. Good luck with your trades!
ATB
Jon
-
Jonetc15
- Lemon Slice
- Posts: 464
- Joined: November 4th, 2016, 3:27 pm
- Has thanked: 275 times
- Been thanked: 44 times
Re: Where are we now
I can't open BigCharts, who've posted the following message:
'Couldn’t find it.
We apologize. Something just happened that shouldn’t have happened. We were unable to load the page you requested.'
Is it just me, or does anyone else have this problem? I'll try to contact them later today in any event.
Jon
'Couldn’t find it.
We apologize. Something just happened that shouldn’t have happened. We were unable to load the page you requested.'
Is it just me, or does anyone else have this problem? I'll try to contact them later today in any event.
Jon
-
vand
- Lemon Slice
- Posts: 821
- Joined: January 5th, 2022, 9:00 am
- Has thanked: 190 times
- Been thanked: 384 times
Re: Where are we now
Worth noting that most of the major indices have now violated the 200dma.
I'm not always a believer in this often heralded line in the sand, but if the 50dma eventually crosses over too then it really could be the end of the bull market.
I personally prefer the fib 233dma and 55dma numbers, but I supposed there's not much difference.
Yeah, Bigcharts is down for me too..
I'm not always a believer in this often heralded line in the sand, but if the 50dma eventually crosses over too then it really could be the end of the bull market.
I personally prefer the fib 233dma and 55dma numbers, but I supposed there's not much difference.
Yeah, Bigcharts is down for me too..
-
vand
- Lemon Slice
- Posts: 821
- Joined: January 5th, 2022, 9:00 am
- Has thanked: 190 times
- Been thanked: 384 times
Re: Where are we now
There is reason to be suspicious of this recent rally.
Advance/Decline indicators show that the rally is lacking breadth in almost all of the major indexes. FTSE 100 is pushing new highs today, but there is a negative breadth divergence as the A/D line remains well below its Feb 2022 peak level. Similarly, breadth in the Nasdaq is really poor despite the price recovery.
https://www.marketinout.com/chart/marke ... cline-line
-
vand
- Lemon Slice
- Posts: 821
- Joined: January 5th, 2022, 9:00 am
- Has thanked: 190 times
- Been thanked: 384 times
Re: Where are we now
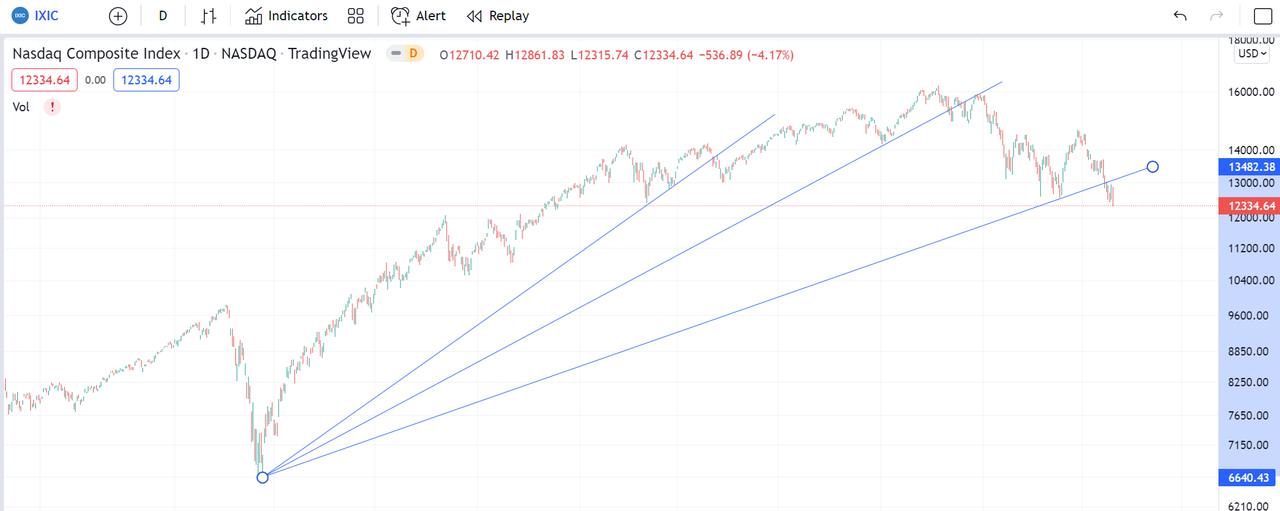
As well as returning it to official bear market territory, Friday's action on Nasdaq saw it violate the shallowest uptrend support from the bottom of the Covid crash - the chances of a new leg down have just considerably increased.

-
BT63
- Lemon Slice
- Posts: 432
- Joined: November 5th, 2016, 1:22 pm
- Has thanked: 59 times
- Been thanked: 121 times
Re: Where are we now
The new 12-month closing low on the Nasdaq tonight is a bad omen.
New 12-month closing lows usually indicate several lower lows coming over the following months.
New 12-month closing lows usually indicate several lower lows coming over the following months.
-
GoSeigen
- Lemon Quarter
- Posts: 4488
- Joined: November 8th, 2016, 11:14 pm
- Has thanked: 1628 times
- Been thanked: 1627 times
Re: Where are we now
Two touches do not a trendline make. Also that chart is not semi-log.
S&P still consolidating IMO. Maybe building a top, but if so there is still work to do.
GS
S&P still consolidating IMO. Maybe building a top, but if so there is still work to do.
GS
-
vand
- Lemon Slice
- Posts: 821
- Joined: January 5th, 2022, 9:00 am
- Has thanked: 190 times
- Been thanked: 384 times
Re: Where are we now
GoSeigen wrote:Two touches do not a trendline make. Also that chart is not semi-log.
S&P still consolidating IMO. Maybe building a top, but if so there is still work to do.
GS
you are of course right about the non log scale.
Here it is in log:
Technically you only need 2 points to make a trendline..
Regardless, it is clear that the short, med & now long term trend for Nasdaq are all Down. This does not bode well for developed world stock markets in general.
The recent breach is the most serious one so far, given the general rule that the less steep the support/resistance line, the more meaningful a break of it should be treated. It's a complex topping pattern rather than anything that represents the sort of simplistic H&S patterns that most traders look for, which is quite typical for a major change of long term trend and keeps people guessing if this is really the big turnaround
-
GoSeigen
- Lemon Quarter
- Posts: 4488
- Joined: November 8th, 2016, 11:14 pm
- Has thanked: 1628 times
- Been thanked: 1627 times
Re: Where are we now
vand wrote:GoSeigen wrote:Two touches do not a trendline make. Also that chart is not semi-log.
S&P still consolidating IMO. Maybe building a top, but if so there is still work to do.
GS
you are of course right about the non log scale.
Here it is in log:
Technically you only need 2 points to make a trendline..
Regardless, it is clear that the short, med & now long term trend for Nasdaq are all Down. This does not bode well for developed world stock markets in general.
Okay, I've only been doing TA for around 15 years so may have this wrong. In my conception a trendline shows the trend a market has been following and that it will follow if the trend continues. Since you have drawn five different trendlines for this market, all starting on the same date, it's not clear to me which one you consider to be the Nasdaq's trend over that period. Also all the trendlines you drew are bullish, yet you say that the short, medium and long-term trends are all down! I can only conclude that you have an entirely different idea of what a trendline is. Perhaps you could explain?
GS
EDIT: To add to my earlier post, to my mind the NDX is testing support right now, so the long-term trend is still very much bullish. I haven't seen a volume chart, but assuming the volume is supportive, a confirmed break of support now would indeed complete a (slightly asymmetrical) head and shoulders which could be an interesting topping pattern and more significant IMO than the break of a few-week-old "trend".
-
vand
- Lemon Slice
- Posts: 821
- Joined: January 5th, 2022, 9:00 am
- Has thanked: 190 times
- Been thanked: 384 times
Re: Where are we now
Any reasonably competent TAer will agree that charting is an art, not a precise science.
Sometimes real life price action doesn't give you a chance to have a clearly and easily defined trendline that acts as support 3 or 4 times before breaking. We use channels, wedges and other patterns to try to interpret..
Some of us even delve into the dark art of FA.
Sometimes real life price action doesn't give you a chance to have a clearly and easily defined trendline that acts as support 3 or 4 times before breaking. We use channels, wedges and other patterns to try to interpret..
Some of us even delve into the dark art of FA.
-
Dod101
- The full Lemon
- Posts: 16629
- Joined: October 10th, 2017, 11:33 am
- Has thanked: 4343 times
- Been thanked: 7536 times
Re: Where are we now
vand wrote:Any reasonably competent TAer will agree that charting is an art, not a precise science.
Sometimes real life price action doesn't give you a chance to have a clearly and easily defined trendline that acts as support 3 or 4 times before breaking. We use channels, wedges and other patterns to try to interpret..
Some of us even delve into the dark art of FA.
And does it make you a better investor?
Dod
-
GoSeigen
- Lemon Quarter
- Posts: 4488
- Joined: November 8th, 2016, 11:14 pm
- Has thanked: 1628 times
- Been thanked: 1627 times
Re: Where are we now
vand wrote:Any reasonably competent TAer will agree that charting is an art, not a precise science.
Sometimes real life price action doesn't give you a chance to have a clearly and easily defined trendline that acts as support 3 or 4 times before breaking. We use channels, wedges and other patterns to try to interpret..
Some of us even delve into the dark art of FA.
Who are you speaking for here when you say "we"? Certainly not me.
You haven't answered what you mean by a "trendline" having doubled down after my first comment. Is the Nasdaq trend bullish or bearish based on that trendline?
GS
-
vand
- Lemon Slice
- Posts: 821
- Joined: January 5th, 2022, 9:00 am
- Has thanked: 190 times
- Been thanked: 384 times
Re: Where are we now
GoSeigen wrote:vand wrote:Any reasonably competent TAer will agree that charting is an art, not a precise science.
Sometimes real life price action doesn't give you a chance to have a clearly and easily defined trendline that acts as support 3 or 4 times before breaking. We use channels, wedges and other patterns to try to interpret..
Some of us even delve into the dark art of FA.
Who are you speaking for here when you say "we"? Certainly not me.
You haven't answered what you mean by a "trendline" having doubled down after my first comment. Is the Nasdaq trend bullish or bearish based on that trendline?
GS
Does it really matter to you how I interpret a chart?
I said that it's clear that the short, medium & long term trend are all down. That is what TA is ALL about - to establish trend, ie the path of least resistance.
If you think I'm wrong you are welcome to draw you own lines and take a contrary position.
Return to “Technical Analysis”
Who is online
Users browsing this forum: No registered users and 3 guests