GeoffF100 wrote:You have to factor in asset price valuations which are much higher than they were historically. QE has drastically reduced interest rates and bond yields. The price premium for lower rated bonds has reduced. Equity valuations have increased correspondingly. Share prices have reduced since the coronavirus hit, but that is in response to a deterioration in the fundamentals. We cannot expect the same returns going forward as we did in the past.
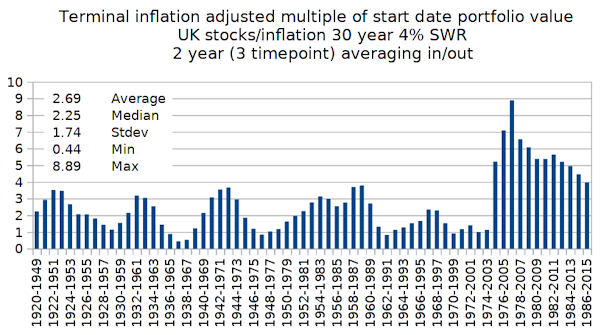
The Trinity study history/years already includes such high (and low valuation, and everything between) periods. Gains arise out of price appreciation, income/dividends, volatility capture (such as yearly rebalancing stock and bonds back to target weighting (a form of 'trading')). The rewards from each broadly compare overall, if that were not the case all investors would focus into the consistent best. Most strive to diversify across those potential rewards (but not all, Options traders for instance might just target Vega). Higher valuations/lower yields/interest rates equates to higher volatility (a 0.1% move in interest rates when yields are down at 1% invokes a more extreme move than a 0.1% move in interest rates when yields are at 5%).
Volatility could spike one year - such as share prices crashing heavily, and thereafter price appreciation and income could do well. There's nothing assured about a current/present high levels of x, y or z meaning that the rewards over the next 10, 20 whatever years will be below average.
Mid 1930's had high PE, low interest rates, some balanced asset allocations saw above average real returns over the subsequent 15 years - nearly twice the broader average. In other cases low valuations have seen subsequent below average outcomes, valuations declined further.
Post 2008/9 financial crisis when long dated (20+ year) gilt yields had declined to relatively low levels had some saying that it was mad to buy/hold such bonds, "yields only had one way to go" (upwards in their minds, inducing price declines (losses)). 2010 and 2011 saw around +10% and +20% gains respectively. Clearly they were wrong. As subsequent low yield (losses expectancy) mental train persisted further - so long dated gilts saw yet further double digit gains in 2014 (+20%), 2016 (+15%) and even again in 2019 (+11%). And its not as though the years between were big down years, 2013 was by far the worst, with a -7% loss and in all the others there was still a mildly (low single digit) nominal gain. Compounding to a +100% total gain since 2009 (to end of 2019), relative to +26% increase in inflation over the same years.
Yes forward time could see actuals outside of historical extremes, a new extreme, but on the basis of what economic/social/political history actually occurred a new extreme would be exceptionally severe. Hope that doesn't occur, don't think it will occur, but as ever there are no guarantees. Even if it did occur, then you have to actually get to physically live through it and out to the other side - that in itself may have a low probability given the circumstances.
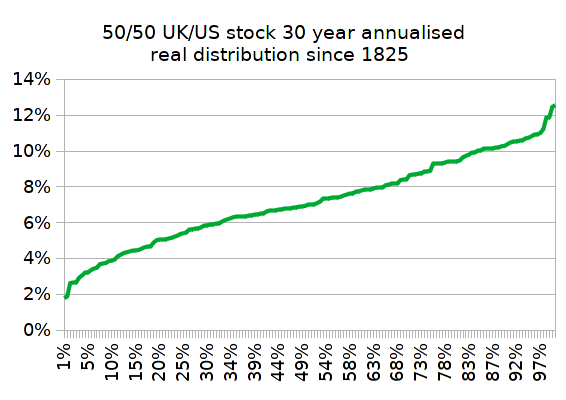
For one of the benchmarks I use I'm seeing figures of a 5.5% annualised real (after inflation) average across the 2000's, pretty much around the longer term average. 2010's has seen that rise to 8.5%, I wouldn't be at all surprised if the 2020's saw that remain up at around 9% real levels, but equally could be down at around the 5% longer term average, maybe even a relatively poor/bad 4% level.
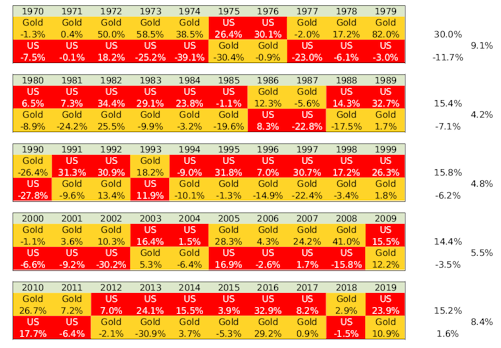
Those are yearly (in £'s total return values for US stock (and gold)) real (after inflation) figures. Rightmost are each decades averages figures. You can extend that Callan periodic table (with caveats - such as accounting for being on a gold standard pre 1932, when money and gold were exchangeable at a fixed rate it made more sense to have someone pay you to store your gold - i.e. hold Treasury Bills that paid interest) right back to the early 1800's and the rightmost values follow similar patterns/values. The only single exception was the 1910's, where the rightmost figure was around 0% - a decade of the Great War and what might be considered as the end of the British Empire.
UK home, US stock, gold ... diversified across £, primary reserve currency (US$) and global currency, holding land, equities, commodity assets ... and I very much suspect that the end of 2020 will look back with a rightmost figure being in the 4% to 9% range for the liquid asset holdings for that decade. No idea as to what sequence of returns actually source that outcome, whether price appreciation or volatility will have been the predominant driver, and would be very surprised if it was down at the 0% to 2% level that some are suggesting is the new SWR 'norm'.