Got a credit card? use our Credit Card & Finance Calculators
Thanks to Wasron,jfgw,Rhyd6,eyeball08,Wondergirly, for Donating to support the site
Drop since year end
-
Mike88
- Lemon Slice
- Posts: 969
- Joined: November 4th, 2016, 6:17 pm
- Has thanked: 112 times
- Been thanked: 271 times
Re: Drop since year end
I hold 50% in cash. My shares, mainly in the form of Unit Trusts, have dropped by 19.4% clearly far worse than most, if not all, of those on here. I know I should have invested more in investment trusts but just about every one I have bought in previous years have slumped to massive discount. Even though I have had a bad year most of my holdings are still in profit.
-
Newroad
- Lemon Quarter
- Posts: 1098
- Joined: November 23rd, 2019, 4:59 pm
- Has thanked: 17 times
- Been thanked: 344 times
Re: Drop since year end
Hi Simoan.
Your point about risk adjusted return is well made. One can perhaps measure a proxy for this (e.g. volatility) but it is impractical for most - I think one just needs to apply common sense and hope that the common sense applied is not too far off the real mark. In that light, I would suggest FCIT is less risky than a portfolio of UK HYP/Value stocks (e.g. like Terry's) - which if you were to agree, would make FCIT's relative outperformance even more significant.
However, on the points about borrowing, share buy backs and anything similar, I think they are red-herrings. A given company's propensity (whether IT or not) to do any/all of these should be factored into the current share price (voting machine) and in the long term in its performance (counting machine). In the end, all one can look at is the latter - with a risk adjusted filter as per the previous paragraph if desired.
Regards, Newroad
-
1nvest
- Lemon Quarter
- Posts: 4460
- Joined: May 31st, 2019, 7:55 pm
- Has thanked: 707 times
- Been thanked: 1375 times
Re: Drop since year end
Bagger46 wrote:1nvest wrote:OldPlodder wrote:1nvest wrote:OldPlodder wrote:
There is something wrong here. My wife has held FCIT for longer than that, but since Sep 1997, for example, her XIRR on FCIT is well in excess of 12%.
Plodder
The FRCL now FCIT data I based the NAV based total return on (extracted from annual reports)....
I'd genuinely be surprised if FCIT had excelled TJH HYP Accumulation by the more than 3% annualised that you suggest!
Comparing those FCIT total returns with MSCI world total returns and the two align reasonably, nowhere near a significant difference, with FCIT marginally out-pacing overall.
I suspect you may have a Beardstown Ladies error such as incorrectly accounting for additions?
Unlikely. unlike you we understand unitisation, and keep very accurate records. The lady in question worked in the City for twenty years, so her data is correct. She can plot her portfolio, or any subset of it, against TJHs data, she remains well ahead. The main reason is that she does no go near the FTSE, and she only put serious money in it when markets tank, so the time to buy is definitely not always now, as hypers are led to believe.
Regards
Plodder
You seem to be unaware that your comparison between an actual portfolio and an IT is itself flawed.
LOL! (Arrogance).The main reason is that she does no go near the FTSE, and she only put serious money in it when markets tank
That explains it, not accounting for the waiting in time cash whilst timing deployment to only when the market tanks. You shouldn't flame others when you clearly don't understand basics.
I think it is you who do not understand basics, your opening sentence on Unitisation demonstrates this clearly.
(I any case anybody who bases his core investment philosophy on the Talmud, a you do, cannot be considered a serious investor in today's world/markets scene). Among my many friends of that 'persuasion' none of them do.
Plodder, as usual, is correct. Any investor who invests in, say, an IT such as FCIT, can get results way different from the returns of the IT itself. Some will undershoot it, the bulk will broadly get similar results to the IT, but enough of them, those who are experienced, PATIENT and awake ( and have the freedom to do so, which not all investors do, which unfortunately most retirees taking the income, thus staying mostly invested cannot do), will exceed its returns. If you look at the returns on, say, MRCH, over the last say 36 years, I doubt this IT has returned an average TR of 13.6% P.A., yet that is precisely the XIRR my mother in law has on MRCH over that whole long period, main reasons: experience, massive patience, knowing when to go in heavy or when to take a large slice of profits to feed back in later...
The individual investor has a great advantage on most fund managers, he can decide at a moment's notice to go into much cash, or some can temporarily introduce new funds when they want. It can make a very wide difference to returns. I have known Plodder and his good lady for enough years to know just how nimble they can be with markets, and in the past their businesses dealings. our shared philosophy on investing has worked well for us indeed, yet we have never held a single ounce of your favourite gold!.
Regards
Bagger
PS:The mantra of 'the time to invest is always now' is a sure recipe for banal outcomes at best.
Timed/rotational rewards will obviously differ. Reference any historic zigzagging stock motion and there will be trough to peak periods that can yield superior rewards than having bough/held. With timing you have to be right twice, entry and exit. Broadly that tends to average the same as the time-averaged measure. With luck ('skill'), some do well, others do worse.
For those without the desired 'skill' the likes of 50/50 yearly rebalanced trading is a mechanical/automated trading approach. Adds after declines, reduces after good-gains. If instead of cash deposits/bonds that are more low volatility/stable, you hold another asset that has a tendency to move counter-direction, such as gold, then that can further enhance trading (rebalance) gains.
Your adversarial manner of posting gives the distinct feel that you may indeed have known OldPlodder a long time, looks very much like the one and same person posting under different avatars.
-
1nvest
- Lemon Quarter
- Posts: 4460
- Joined: May 31st, 2019, 7:55 pm
- Has thanked: 707 times
- Been thanked: 1375 times
Re: Drop since year end
OldPlodder wrote:tjh290633 wrote:1nvest wrote:I'd genuinely be surprised if FCIT had excelled TJH HYP Accumulation by the more than 3% annualised that you suggest!
Comparing those FCIT total returns with MSCI world total returns and the two align reasonably, nowhere near a significant difference, with FCIT marginally out-pacing overall.
I suspect you may have a Beardstown Ladies error such as incorrectly accounting for additions?
As it happens I have some comparative figures. I began two savings plans for my grandchildren in FCIT, one in June 2003, the other in March 2015. The IRR from those dates are:From FCIT IRR TJH IRR*
27-Jun-03 13.65% 9.33%
02-Mar-15 10.56% 4.65%
* from 1st Month for accumulation units.
FCIT has much more exposure to the US market and also to private equity. My HYP is aimed at income in the UK.
TJH
QED
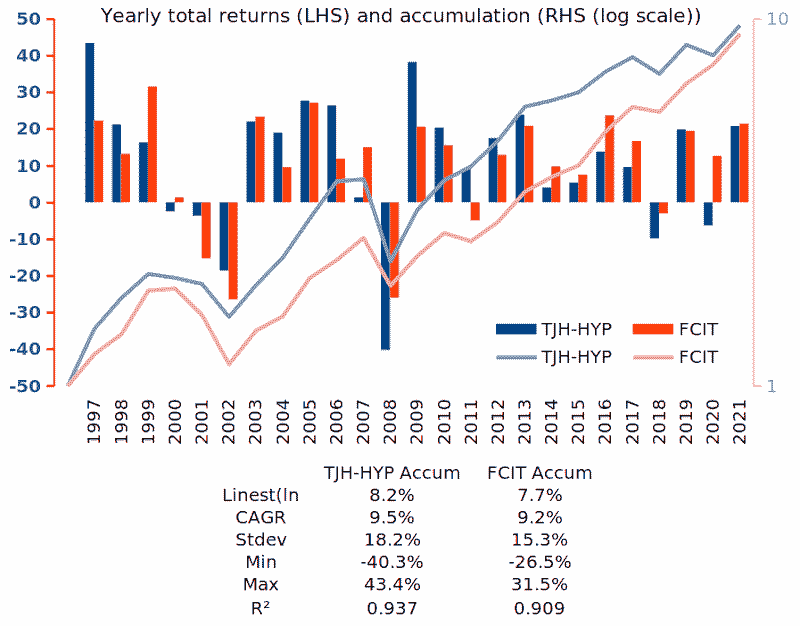
Take the later of those two dates, the 2015 date, and look at the growth lines in that chart from that date. Since 2015 the pink line has clearly closed down the blue line. If you'd held that pink line (FCIT) over those years you'd have relatively outperformed the other (TJH HYP).
As would the blue line provided a higher return from the start year up to 2006/7. Yes if you were successful in just holding those choices over those times then broadly the rewards will have been considerably better. Not disputing your claimed XIRR or timing, rather just my data that you contest as being wrong, isn't (other than for trivial differences such as my figures don't perfectly align with what Morningstar show for data since 2012, but that's just fractional differences (noise)). For your higher rotational/timed XIRR universally there are others whose timing/rotations may have been relatively poor.
-
simoan
- Lemon Quarter
- Posts: 2109
- Joined: November 5th, 2016, 9:37 am
- Has thanked: 469 times
- Been thanked: 1467 times
Re: Drop since year end
Newroad wrote:Hi Simoan.
However, on the points about borrowing, share buy backs and anything similar, I think they are red-herrings. A given company's propensity (whether IT or not) to do any/all of these should be factored into the current share price (voting machine) and in the long term in its performance (counting machine). In the end, all one can look at is the latter - with a risk adjusted filter as per the previous paragraph if desired.
Regards, Newroad
What you describe sounds a lot like the Efficient Market Hypothesis (EMH) which has long been debunked. This idea that all information in the public domain means the current share price completely reflects the value of a company is pure bunkum. Just consider an Investment Trust as an example. If what you say is true, how could an IT ever trade at a price that does not exactly match its Net Asset Value? Given the underlying assets are highly liquid equities, listed on public markets and for which everyone knows the exact price every second of the day between 8am and 4:30pm, how on earth does an IT ever trade at a premium or discount to NAV? It should not be possible given what you describe.
All the best, Si
-
Dod101
- The full Lemon
- Posts: 16629
- Joined: October 10th, 2017, 11:33 am
- Has thanked: 4343 times
- Been thanked: 7536 times
Re: Drop since year end
simoan wrote:Newroad wrote:Hi Simoan.
However, on the points about borrowing, share buy backs and anything similar, I think they are red-herrings. A given company's propensity (whether IT or not) to do any/all of these should be factored into the current share price (voting machine) and in the long term in its performance (counting machine). In the end, all one can look at is the latter - with a risk adjusted filter as per the previous paragraph if desired.
Regards, Newroad
What you describe sounds a lot like the Efficient Market Hypothesis (EMH) which has long been debunked. This idea that all information in the public domain means the current share price completely reflects the value of a company is pure bunkum. Just consider an Investment Trust as an example. If what you say is true, how could an IT ever trade at a price that does not exactly match its Net Asset Value? Given the underlying assets are highly liquid equities, listed on public markets and for which everyone knows the exact price every second of the day between 8am and 4:30pm, how on earth does an IT ever trade at a premium or discount to NAV? It should not be possible given what you describe.
All the best, Si
Well Newroad said 'should' not 'does' . Furthermore investors hold ITs for instance for different reasons and not everyone anticipates a winding up (which is really the only practical way to get full value from an IT)
Dod
-
Newroad
- Lemon Quarter
- Posts: 1098
- Joined: November 23rd, 2019, 4:59 pm
- Has thanked: 17 times
- Been thanked: 344 times
Re: Drop since year end
Hi Simoan.
Happy to discuss the EMH (and in equities, I'm 50% active, 50% passive - were I true believer of it, I would presumably be 100% passive) but it's a straw man in this context.
My point was that (opinions related to) all the factors you allude to, and others, are baked into the price, even if imperfectly - hence the voting machine (and Dod's related comment). The relevant sentence is that last one that you quoted.
Regards, Newroad
-
1nvest
- Lemon Quarter
- Posts: 4460
- Joined: May 31st, 2019, 7:55 pm
- Has thanked: 707 times
- Been thanked: 1375 times
Re: Drop since year end
Bagger46 wrote:yet we have never held a single ounce of your favourite gold!.
Not my favourite, not attached to any one particular asset. You're just another of the many who don't understand the value of including some gold into a broader portfolio - just assume its a lump of metal that pays no interest/dividends despite having done so relatively consistently across time. But where its "dividend" is via trading/blending.
Low/varying correlation to stocks and even simple 50/50 rebalanced tends to add 1% volatility-pumping/rebalance-benefit, similar to as though it had yielded a 2% dividend.
Pre 1932 and money was gold, so depositing money into Gilts yielded interest (gold dividend).
Selling Covered Calls against your gold yields a "gold dividend".
Adding a distinctly different asset to a portfolio that has a tendency to move counter cycle to stocks tends to improve the overall portfolio risk-adjusted rewards.
In other walks, such as in India where its common for people to hold/save-to gold in reflection of distrust of their domestic legal tender/currency or simply because of lack of easy access to local banks; Similar to pay-day-loan options are widely available, where you can deposit a ounce/whatever of gold and instantly receive 70% of the spot gold value in cash, and a month/whatever later get your gold back after paying a 0.8%/month type interest rate. Disappear and they get to keep your gold - acquired at a 30% discount; When re-claimed they benefit by a 10%/year type gain (gold dividend). Whilst for a gold holder they can get the likes of £1000 of currency/cash near instantly for a £8/month type cost (both parties happy with the arrangement/deal).
-
Bubblesofearth
- Lemon Quarter
- Posts: 1111
- Joined: November 8th, 2016, 7:32 am
- Has thanked: 12 times
- Been thanked: 452 times
Re: Drop since year end
1nvest wrote:Not my favourite, not attached to any one particular asset. You're just another of the many who don't understand the value of including some gold into a broader portfolio - just assume its a lump of metal that pays no interest/dividends despite having done so relatively consistently across time. But where its "dividend" is via trading/blending.
Low/varying correlation to stocks and even simple 50/50 rebalanced tends to add 1% volatility-pumping/rebalance-benefit, similar to as though it had yielded a 2% dividend.
Pre 1932 and money was gold, so depositing money into Gilts yielded interest (gold dividend).
Selling Covered Calls against your gold yields a "gold dividend".
Adding a distinctly different asset to a portfolio that has a tendency to move counter cycle to stocks tends to improve the overall portfolio risk-adjusted rewards.
In other walks, such as in India where its common for people to hold/save-to gold in reflection of distrust of their domestic legal tender/currency or simply because of lack of easy access to local banks; Similar to pay-day-loan options are widely available, where you can deposit a ounce/whatever of gold and instantly receive 70% of the spot gold value in cash, and a month/whatever later get your gold back after paying a 0.8%/month type interest rate. Disappear and they get to keep your gold - acquired at a 30% discount; When re-claimed they benefit by a 10%/year type gain (gold dividend). Whilst for a gold holder they can get the likes of £1000 of currency/cash near instantly for a £8/month type cost (both parties happy with the arrangement/deal).
Gold, like property, is a real asset. Cash, bonds and equities are financial assets. I am increasingly of the opinion that holding a mix of both real and financial assets is a good idea.
BoE
-
1nvest
- Lemon Quarter
- Posts: 4460
- Joined: May 31st, 2019, 7:55 pm
- Has thanked: 707 times
- Been thanked: 1375 times
Re: Drop since year end
Bubblesofearth wrote:Gold, like property, is a real asset. Cash, bonds and equities are financial assets. I am increasingly of the opinion that holding a mix of both real and financial assets is a good idea.
Don't forget currencies. If you historically stuffed equal values of US$ and gold under your mattress then that alone offset a significant amount of UK inflation. Since 1896, all but -0.6% (assuming T-Bills were held pre 1932 ending of gold/money convertibility as that was like holding gold that paid interest).
Modern day ancient Talmud style (thirds each land, business, in-hand advice) ...
Initial third in a UK house, has imputed rent benefit and house+imputed is similar to stock+dividends.
A third in US$, primary reserve fiat currency, invested equally in BRK and MKL that pay no dividends.
A third in physical gold, legal tender coins (tax exempt).
Collectively like a 67/33 equity/gold asset allocation. Broadly if you held gold or bonds outcomes tended to be much the same, at least in gross terms, after taxation of bond interest however !!!
Once loaded, no further rebalancing, just draw a 3% SWR from the stock/gold assets, whichever is the higher value of the two at the time. Which is a form of partial rebalancing.
Historic outcomes whether you yearly rebalanced back to target weighting, or just left as-is (with withdrawals from the most above target weighting, or additions/savings added to the most below target weighting), tended to broadly compare, similar 30 year final values either way. Coin flip as to whichever was the better.
Tax return report ... income 0%. Capital gain may be payable on the SWR amount if some stocks are sold, reduced by yearly CGT allowance, or exempt if held inside a ISA.
Currency diversification of £, and US$ fiat currencies, global non-fiat currency (gold).
Asset diversification of land, stocks, commodity.
Counter-party risk is just the initial third in stocks, land (home) and gold (physical) are in-hand, zero counter-party risk.
Time to cash in-hand, T+3. But perhaps more like a 4 day notice account in practice i.e. three days to sell some shares and have the sale proceeds added to your account, and another day to transfer the cash to your regular bank/spending account. In the case of liquidating gold, more often you can do that the same day, at least for smaller amounts such as one or two Britannia one ounce gold coins sold to a local dealer (for around £3K of cash at recent prices).
The 3% SWR above = 2% relative to total wealth. Supplemented with imputed rent benefit, the rent you'd otherwise have to find/pay. Historically 4.2%, so 1.4% proportioned to a third of total wealth. Combined 2% + 1.4% = 3.4%. SWR observations are typically measured across 30 year periods, so in effect 3.33% x 30 years = the return of your inflation adjusted capital via 30 yearly instalments. If you start with all of your capital at risk, have half having been returned after 15 years (via SWR), all returned after 30 years, then average capital at risk = 50%. Typically the above ended 30 years with your inflation adjusted wealth still also intact, so 2x total return. ( 2 / 0.5 )^(1/30) = 1.0473 = 4.73% annualised real rate of return on average capital at risk.
Take your SWR monthly, and its just a case of selling some gold, or some shares to provide your regular inflation adjusted 'wage'. Beyond that no other actions are required.
Historic prices ...
A no tinker No Yield Portfolio (NYP). Where 25/25/50 BRK/MKL/Gold in 2022 resulted in a +15% gain. And where you define how much and when DIY dividends are paid out.
Return to “Portfolio Management & Review”
Who is online
Users browsing this forum: No registered users and 34 guests