stacker512 wrote:I have started to look into creating a spreadsheet for my S&S ISA, and trying to get to grips with how to calculate XIRR.
I have recorded this:
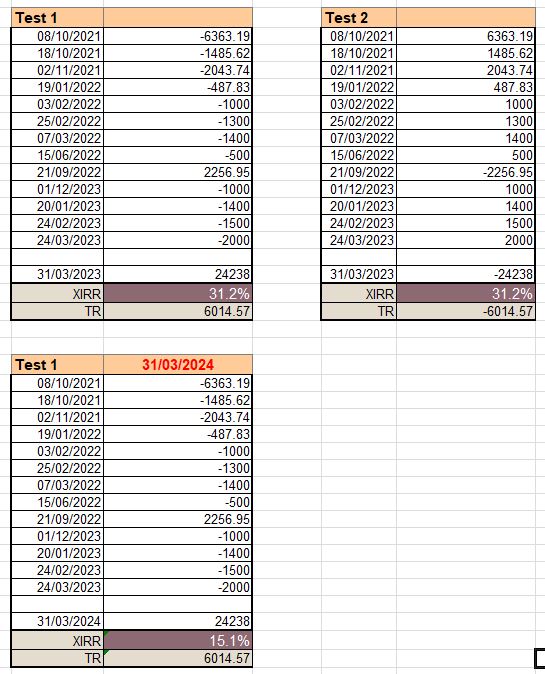
Date         Cashflows  Notes
2021-10-08    6,363.19  Initial
2021-10-18    1,485.62
2021-11-02    2,043.71
2022-01-19      487.83
2022-02-03    1,000.00
2022-02-25    1,300.00
2022-03-07    1,400.00
2022-06-15      500.00
2022-09-21   -2,256.95  Widthdrawal
2022-12-01    1,000.00
2023-01-20    1,400.00
2023-02-24    1,500.00
2023-03-24    2,000.00
2023-03-31  -24,238.00  Current
XIRR reports as 29.96%
Annualised reports as 19.43%
Time period is 1.48 years.
Is this actually correct value for the XIRR? Various places online seemed to report wildly different values.
It may be irrelevant, I don't know, but I do wonder a bit what is going on here.
You show a "Withdrawal", presumably a withdrawal of cash from the ISA, and "Current", presumably a current valuation of the ISA (a pseudo withdrawal)*. So presumably all the others are investments of cash into your ISA, coming from outside the ISA? It's just that cash injections of £1,485.62, £2,043.71 and £487.83 sound a little odd to me. They sound like dividend payments! If from dividends paid
outside the ISA going into the ISA as cash, fair enough. But, if they were dividends coming from shares already
inside the ISA - and not paid out - then, IMO, this would be a misapplication of XIRR and the figure for XIRR would be meaningless.
* BTW - I always use a positive value for these in XIRR, as they are cash flows
towards you or your bank account - and negative for cash investments going in. The numerical value of XIRR is though unaffected.