Some investors want above all to secure and preserve the purchasing power of lump sum capital over prolonged periods. I am never quite sure why, although keeping a nest egg for late-life care, or a nest egg until a baby hits adulthood, could be reasons.
Conservation gets more traction when times are fraught: war threats, resurgent living costs, markets looking toppy. Sounds familiar? Various ways of pinning down purchasing power have been advocated in my 50 years in the market: gold, index-linked securities, absolute return funds, mechanical asset-allocation switching wheezes such as the late Harry Browne's Permanent Portfolio.
In 2011 I put in my twopennyworth with the Conviction Five: a combo of investment trusts designed to fluctuate far less than the broad UK equity market by going beyond the churning of blue chips. The C5 might delve into precious metals, prospect abroad, buy or sell its own stock to keep asset valuations close to market prices, magnify trends by borrowing. A flexible toolkit would ensure that, in the motto of one member, it safeguarded and eventually enlarged the real value of the original stake "in that order" in the longer run. Meantime it would seek to minimise gyrations over shorter spells which might inflict pain on forced sellers.
The C5, whose latest report card is here, has been a 'hero in error':
viewtopic.php?f=96&t=32752&p=469844#p469844
It swelled in value chiefly because one constituent, though with a setback lately, exploded into a multi-bagger. Its gratifying but accidental gains may be kissed goodbye if it goes on weakening as it has since the autumn. But I look for quiet and intermittent accretion of purchasing power, small and tolerable setbacks (there must be some) and a portfolio jumping around a lot less than a broad index of UK stocks. Like all my inventions it should be easy to run, to the point of narcolepsy. Excitement, for good or ill, is anathema.
So I have given the C5 a clip round the ear and devised what will be (promise) my last patent portfolio-- the Defensive Three (D3). It modifies the C5's concept, whereby three Steady Eddies confessedly dedicated to wealth preservation were flanked by two racier entries to inject a little fizz. Now the fizz has overflowed, let us see how three proudly boring trusts would have handled the brief.
The D3 retains Personal Assets (PNL) and Capital Gearing (CGT) but kicks out Independent and Lindsell Train. Instead of Ruffer Investment it takes in another 'conviction' operation which ploughs a distinctive furrow: RIT Capital Partners (RCP) (1). The furrows differ, but these three share a feel for Buffettesque 'don't lose money', a willingness to try anything, a penchant for going against the herd's long-equity/risk-off default state. In brief, the D3 are mavericks with records estimable enough to vindicate wayward ways.
Like my four other model baskets, the Defensive Three has been backtracked to Jan. 13, 2006-- in line with my 'HYP-othetical' HYP06, which comprises passively held FTSE 100 shares only. But would anyone pursuing safety first have plumped for these three 16 years ago, or is it another jaunt with rear mirror driving?
I hold that the D3 would have been a realistic pick on the basis of what was then known. By 2006 each member had established a reputation for doing the business without rocking the boat: more so than Ruffer, whose managers had launched it only in 2004 in Guernsey.
Peter Spiller had been running Capital Gearing for 20 years, and still is: he was renowned for careful rotation of assets to dodge seismic shocks. Ian Rushbrook, manager, and Hamish Buchan and Robin Angus, supervisory directors, were an Edinburgh team professing a stern, almost Calvinist, outlook, the 'in that order' laddies. Both trusts were for the sort of rich folks who bank privately and want to hand on liquidity to their heirs.
RIT had been a different critter. It was floated in 1988 to house the long-term investments of J Rothschild Holdings, the British tip of that family's iceberg. Jacob Rothschild, heir to the fortune, at first ran it in alliance with Mark Weinberg and Jimmy Goldsmith. None could be called a prudent hoarder of other people's money: RIT buckled swashes and took some purlers in the Nineties, but some years before Y2K Day it calmed down. Jacob began to talk about limiting risks and avoiding speculation, so that it came to be regarded as a preservationist first and foremost.
By 2006 the new image was firmly delineated, backed by absolute-return and hedging strategies and a buildup of private equity holdings to be left to mature in their own good time. RIT therefore would have recommended itself in 2006 as the moderately 'fizzy' one in the trio, willing to go a bit further out on a limb. Also, a change of policy backed by huge inherited revenue reserves from the spinoff let RIT jack up the dividend to a yield closer to a global growth trust's, supplying some income to supplement capital growth. Even a conviction-trust batch needs a trickle to compensate for down years in markets, but the other two were not interested in growing dividends.
Were there any other candidates? Not that I can see. Nor have any established similar credentials afterwards. Preservationist forums are still besotted with CGT, PNL, Ruffer and Rothschild. Strange that an appreciable demand has inspired no imitators. Perhaps the new paradigm of inflationary, low-growth economies will bring some.
The postulates used here as as for the other baskets: £75,000 was placed in equal amounts, 1% purchase costs, no unforced trimming or switching, no income reinvested.
CAPITAL
The Defensive Three's Dec. 31 market values; nominal and real percentage changes/performance in percentage points plus or minus versus the FT All-Share Index:
2006: £78,975, +5.3, +0.9/-6.0
2007: £77,067, -2.4, -6.4/-4.4
2008: £72,765, -5.6, -6.5/+27.2
2009: £86,896, +19.4, +17.0/-5.5
2010: £99,888, +15.0, +10.2/+4.0
2011: £102,901, +3.0, -1.8/+9.7
2012: £105,891, +2.9, -0.2/-5.3
2013: £103,297, -2.4, -5.1/-19.1
2014: £110,654, +7.1, +5.5/+9.3
2015: £118,433, +7.0, +5.8/+9.5
2016: £133,977, +13.1, +10.6/+0.7
2017: £143,043 +4.5, +0.4/-4.5
2018: £138,270, -1.3, -4.0/+11.7
2019: £15o,574, +9.0, +6.8/-5.2
2020: £156,398, +3.8, +2.6/+16.3
2021: £184,332, +17.9, +10.4/-5.3
And for comparison the C5:
2006: £84,060, +12.1, +7.7/+0.8
2007: £76,957, -8.4, -12.4/-10.5
2008: £70,932, -7.8, -5.7/+25.0
2009: £88,518, +24.8, +22.4/-0.2
2010: £104,493, +18.0, +17.2/+7.1
2011: £104,743, +0.2, -4.6/+6.9
2012: £116,310, +11.0, +7.9/+2.8
2013: £124,875, +7.4, +4.7/-9.3
2014: £131,970, +5.7, +4.1/+7.8
2015: £159,806, +21.1, +19.9/+23.6
2016: £208,661, +30.6, +28.1/+18.1
2017: £219,673, +5.3, +1.2/-3.7
2018: £243,389, +10.8, +8.1/+23.7
2019: £259,609, +6.7, +4.5/-7.5
2020: £294,612, +13.5, +12.6/+25.9
2021: £286.457, -2.8, -9.9/-17.3
After almost 16 years to Dec. 31, 2021, the D3 would have grown to £184,332. This is a real gain, after deflation by the Retail Prices Index, of 2.4% compound pa. Such is the desired 'fizz', a modest but persistent fillip so that purchasing power has become 52% more than the £122, 573 required to match inflation. Call it the reward for sitting tight and doing nowt.
In 2006-21 the C5 would have galloped ahead to £286,457, a real compound growth rate of 5.4% pa for a 137% addition to purchasing power. So if it was tranquillity you were after, the D3 delivered it... to the tune of a £102,000 shortfall. However you would have slept well nearly all the time: between year ends the D3 lost real value six times, but the worst were under 7% in 2007 and 2008. This was when the Global Financial Crisis was giving all-equity portfolios a far harsher drubbing. The only other annual decline of more than 5% was in 2013. Rebounds have more than made up for limited and brief lapses. OTOH the Conviction Five was also pretty peaceful except when Lindsell Train ignited, and that is an upset most would find easy to forgive. It remains to be seen if and when the C5 will misbehave in the opposite, disagreeable direction.
For those who care about relative performance, the D3 started shakily, trailing the FT All-Share Index in three of its first four years. But in 2008, the nadir of the GFC, it displayed fortitude, beating the FTAS by 27%. That has been its best to date, though in the plague year of 2020 it outperformed by 16%, resisting the ebb tide. Again, 2013 was its frailest time; it ought not to have fallen harder than a mildly recessional stock market. In 2017, 2019 and last year it lagged the All-Share, but in a rising market. 'Good Enough is Better than Even Better', as an old windbag used to say.
The C5's ascendancy is not only because Lindsell Train took off in 2015. At Dec. 2014 the portfolio was already worth £132,000 to the D3's £111,000. They had completed the GFC ordeal more or less level pegging, but from 2010 the Five got more out of the rebound.
CONSTITUENTS
Another inciter of insomnia among some is the fear that a portfolio is getting out of kilter, with one component becoming too potent or feeble a contributor. Lindsell Train in the C5 exemplifies such waywardness. Has the Defensive Three stayed more balanced?
Year-end percentage weights (average), and at six moments of the D3's life: 2007, when the market was beginning to sicken; 2009, after the Quantitative Easing medicine; 2013, following a lesser fit of nerves; 2016, when the C5's Lindsell Train boom began; 2020 and 2021, apres covid fright and relief, and after LT blew off somewhat:
CGT: 34.5: 31.8/36.4/37.0/33.8/36.3/33.6
PNL:30.0: 32.8/31.9/30.8/29.0/28.9/27.0
RCP: 33.1: 35.4/31.8/32.2/27.2/34.9/39.4
Ideally each D3 trust would have accounted for exactly 33.3% recurring of the capital result at all times. Not quite, but at the chosen anniversaries none sank to a quarter rather than a third portion, nor grabbed as much as two-fifths. Over the D3's life Capital Gearing has mostly overperformed a little, without nearing 40%; Personal Assets drifted from a slightly sub-average contribution at best to below 30%; and the designated gunslinger, RCP, has hovered around one-third except in 2021, when everything clicked during the flu rebound, and in 2016 when it was acting very cautious. ('There could well be a period ahead of us when the avoidance of risk is as high a priority as the pursuit of gain.'- Lord R).
CGT and PNL employ tight discount control, which mitigates swings of opinion about the share price. Nor do they borrow money. RIT is teed up to be a mite more volatile, and PNL the most doggedly calm, correlating inversely with its lack of daring rotations-- imagine it taking a flier on bitcoin like Ruffer!
Under Sebastian 'Boring's Fine' Lyon of Troy Asset Management, who succeeded Ian Rushbrook as manager in 2009, PNL always holds a slug of Nick Train-type brands-with-moats equities (40-75% of PNL) plus gold. American index-linked government bonds are another safe harbour. Those options have been unfashionable for years, hence PNL stayed underweight.
Lyon keeps saying he will go hard back into shares when they are cheap enough, and has missed several boats awaiting that frabjous day. CGT's Peter Spiller has stuck to his guns and has a succession plan in place. Both gents ran scared of inflation when others laughed it off, and finally saw their forebodings substantiated. I discern no drift towards another 'hero in error' outcome, and no call for the secateurs in our Garden of Tranquillity.
CAGRs of share prices (% pa) in 2006-22, standard deviations and FE Trustnet Risk Scores at Feb. 3 were:
CGT: 5.9/8.0/40
PNL: 4.4/7.2/50
RCP: 6.9/11.2/143
----------------------
D3: 5.8/7.2/68
C5: 13.0/14/117
The D3's price growth has been less than half the C5's, offset by standard deviation and a Risk Score (measuring volatility over the past three years) also half as great. Trustnet uses the FTSE 100 as its benchmark for risk; the D3 is only two-thirds as prone to ups and downs, whereas the C5, galvanised by Lindsell Train, is more likely to leap about than the broad market. Within the D3, RCP has an inverse relationship between Risk Score and share price velocity.
INCOME
On purchase the trio would have yielded ~0.5% historic. Despite RCP becoming more distributive, the D3 yield is nowadays typically 1.5% or lower, half or less that of the All-Share Index. Throughout the 16 years to 2022, capital profit accounted for nearly nine-tenths of the combined return; and although Lindsell Train's dividends soared in the past four years, the C5's capital/income split was the same as the D3's. These baskets are not, repeat not, for investors who regard payouts as more than pourboires.
Nominal and real percentage changes between calendar years and purchasing power/indexed to 2006:
2006: £630/100
2007: £681, +8.0, +4.0/104
2008: £784, +15.2, +14.3/119
2009: £962, +22.7, +20.3/143
2010: £906, -5.9, -10.7/128
2011: £867, -4.2, -8.0/116
2012: £1,516, +74.8, +71.7/200
2013: £1,486, -2.0, -4.7/190
2014: £1,523, +2.5, +0.9/192
2015: £1,587, +4.2, +3.0/198
2016: £1,624, +2.3, -0.2/197
2017: £1,640, +1.0, -3.1/191
2018: £1,750, +6.7, +4.0/199
2019: £1,873, +7.0, +4.8/208
2020: £1,984, +5.9, +4.7/216
2021: £2,026, +2.2, -5.3/207
And for the C5:
2006: £921/100
2007: £1,113, +20.9, +16.9/117
2008: £1,232, +10.7, +9.8/128
2009: £1,564, +26.9, +24.5/160
2010: £1,726,+10.3, +5.5/169
2011: £1,516, -12.2, -17.0/140
2012: £1,517, +0.1, -3.0/136
2013: £1,966, +29.6, +26.9/172
2014: £1,973, +0.4, -1.2/170
2015: £2,115, +7.2, +6.0/180
2016: £2,687, +27.0, +24.5/225
2017: £2,785, +3.6, -0.5/224
2018: £3,750, +34.7, +32.0/295
2019: £4,885, +30.3, +28.1/378
2020: £6,756, +38.3, +37.4/519
2021: £7,226, +7.0, -0.1/518
Totals to date: £21,840 for the Defensive Three, averaging 1.2% on market value. Compound growth 5.0% pa real, faster than any other basket but from so low a base.
For the C5, £43,731 or 1.7%. It first harvested more than £2,000 in 2015, six years earlier, so it was a little 'juicier' before the LTI boom. Compound growth in 16 years was 11.6% real.
----------------------------------------------------------------------------------------------------------------------------------
(1) I tested a Defensive Four which kept Ruffer as a third 'don't lose money' pick, spreading theoretical risk a little thinner. But the capital return for 16 years was barely different-- £104,190 versus the D3's £104,041-- and the income came out much the same. The three selected trusts seem respectable enough to soothe fears about too few eggs in one basket. Ruffer is registered offshore and has a very undemanding benchmark linked to base rate.
Got a credit card? use our Credit Card & Finance Calculators
Thanks to Anonymous,bruncher,niord,gvonge,Shelford, for Donating to support the site
The Defensive Three: 2006-2022
-
Luniversal
- 2 Lemon pips
- Posts: 157
- Joined: November 4th, 2016, 11:01 am
- Has thanked: 15 times
- Been thanked: 1163 times
-
absolutezero
- Lemon Quarter
- Posts: 1510
- Joined: November 17th, 2016, 8:17 pm
- Has thanked: 544 times
- Been thanked: 653 times
Re: The Defensive Three: 2006-2022
A very interesting a detailed thesis here. Thanks for posting it.
I suspect this post is something I will come back to should calamity hit and/or inflation takes hold (which it may well do).
The difference between CGT's rambling portfolio and PNL's much more concentrated portfolio is fascinating given their similar performance over the last 5 years.
I suspect this post is something I will come back to should calamity hit and/or inflation takes hold (which it may well do).
The difference between CGT's rambling portfolio and PNL's much more concentrated portfolio is fascinating given their similar performance over the last 5 years.
-
1nvest
- Lemon Quarter
- Posts: 4565
- Joined: May 31st, 2019, 7:55 pm
- Has thanked: 727 times
- Been thanked: 1446 times
Re: The Defensive Three: 2006-2022
Luniversal wrote:Some investors want above all to secure and preserve the purchasing power of lump sum capital over prolonged periods. I am never quite sure why, although keeping a nest egg for late-life care, or a nest egg until a baby hits adulthood, could be reasons.
Or as a means to achieve their goal with the least amount of risk being taken. If a low risk (low volatility) choice has as much chance of supporting a 30 year 4% initial inflation adjusted income as other more volatile alternatives, then their objective might be met and its just a question of the amount of surplus capital being left to heirs/charities.
Conservation gets more traction when times are fraught: war threats, resurgent living costs, markets looking toppy. Sounds familiar? Various ways of pinning down purchasing power have been advocated in my 50 years in the market: gold, index-linked securities, absolute return funds, mechanical asset-allocation switching wheezes such as the late Harry Browne's Permanent Portfolio.
Coincidentally, I've just been compiling data for a Permanent Portfolio with Larry Portfolio twist. Long dated Gilts are somewhat out of favour at more recent low yields, so applying a Larry (Swedroe) twist to that and shifting bond risk (long dated treasuries risk) over to the stock side and increasing stock risk (via more volatile FT250 stock holdings) results in a 25% FT250, 25% gold, 50% short term Gilts blend. Calculating D3 yearly total returns and comparing that to the Permanent Portfolio with Larry Portfolio Twist (PPLPT) and ...
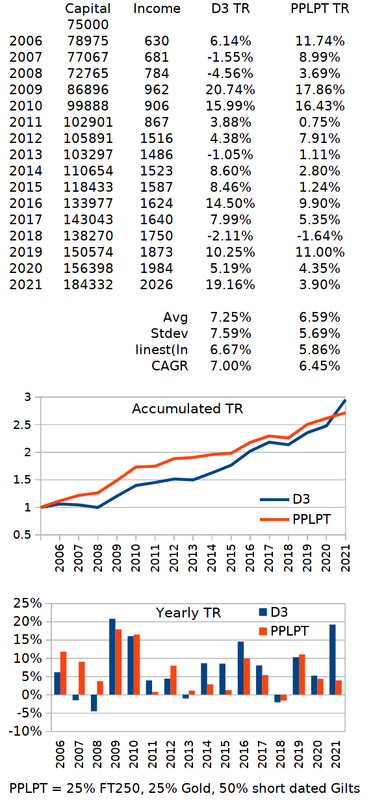
similar characteristics/outcome. On a risk adjusted basis and using linest(ln ... i.e. the slope of the exponential trend lines, divided by the standard deviation in yearly total returns, has the PPLPT yielding the higher (better) risk adjusted reward across those years.
A concern for me is that well managed active funds/investment-trusts as subject to the risk of often elderly experienced managers being replaced through retirement/death, more so given that a investor might have their own 30+ year time horizon still yet to run.
Thanks Luniversal. I love your prose and ideas, thanks for sharing.
-
1nvest
- Lemon Quarter
- Posts: 4565
- Joined: May 31st, 2019, 7:55 pm
- Has thanked: 727 times
- Been thanked: 1446 times
Re: The Defensive Three: 2006-2022
1nvest wrote:Luniversal wrote:Some investors want above all to secure and preserve the purchasing power of lump sum capital over prolonged periods. I am never quite sure why, although keeping a nest egg for late-life care, or a nest egg until a baby hits adulthood, could be reasons.
Or as a means to achieve their goal with the least amount of risk being taken. If a low risk (low volatility) choice has as much chance of supporting a 30 year 4% initial inflation adjusted income as other more volatile alternatives, then their objective might be met and its just a question of the amount of surplus capital being left to heirs/charities.
Consider this US example. In the average (50th percentile) case left much the same as the inflation adjusted start date amount after a 4% 25 year SWR (65 year old through to age 90) near 100% success rate and that's with the 'worst 5 years first' Monte-Carlo simulation setting.
This link shows the total return growth history since 1972
Return to “Investment Strategies”
Who is online
Users browsing this forum: No registered users and 15 guests