bruncher wrote:zico wrote:Just a brief reminder about keeping this thread on topic to discussions about modelling and data, and avoiding getting into potentially political arguments about opposing views - it's easy to get sidetracked, and I'm probably as guilty as anyone.
Anyway, right back on topic, here's a link to the latest ONS mortality statistics on Covid-19 by ethnic groups.
The summary report is clear & easy to read, but here's my summary and take on the main findings.
Black and Asian people have 4 times the White death rate, reducing to 1.9 when adjusted for age, demographics and underlying health.
ONS study doesn't correct for occupation type - seems intuitively likely that this factor could explain much of the difference, as London NHS and care homes and other public-facing jobs likely to have a higher proportion of BAME staff than most other occupations - but that's just my theory, unsupported by proper data.
ONS shows Chinese people have a very similar death rate to White people. This is important because it means the stats from China (if they can be trusted) will apply equally to the White ethnic group.
https://www.ons.gov.uk/peoplepopulation ... 0april2020
The figures for difference between 'white' and 'BAME' given in the press is up to X4 difference, but there's often a conflation of "more likely to contract Covid-19" and "more likely to die from Covid-19 when infected".
The issue is increasingly taken up in politics, hence the importance of understanding what is going on, as some groups understandably claim they need special protection.
What I have not seen in any modelling is any recognition of the potential differences in the way different ethnic/cultural groups have responded to the Government's instructions for social isolation during lockdown, which I feel could be significant just as I agree that occupation is going to be a major factor.
Whilst I agree with zico's comments about the study being easy to read, it is section 4 of the technical appendix (
https://www.ons.gov.uk/peoplepopulation ... ethodology ) which contains the detailed results. These are presented in the form of two charts separately for males and females and show the "odds ratio" for the likelihood of death for specific ethnic groups compared to the White ethnic group. Death in these circumstances is defined as death from/with Covid-19 in the 6 week study period to 10 April 2020. Courtesy OGL, the charts are shown below.
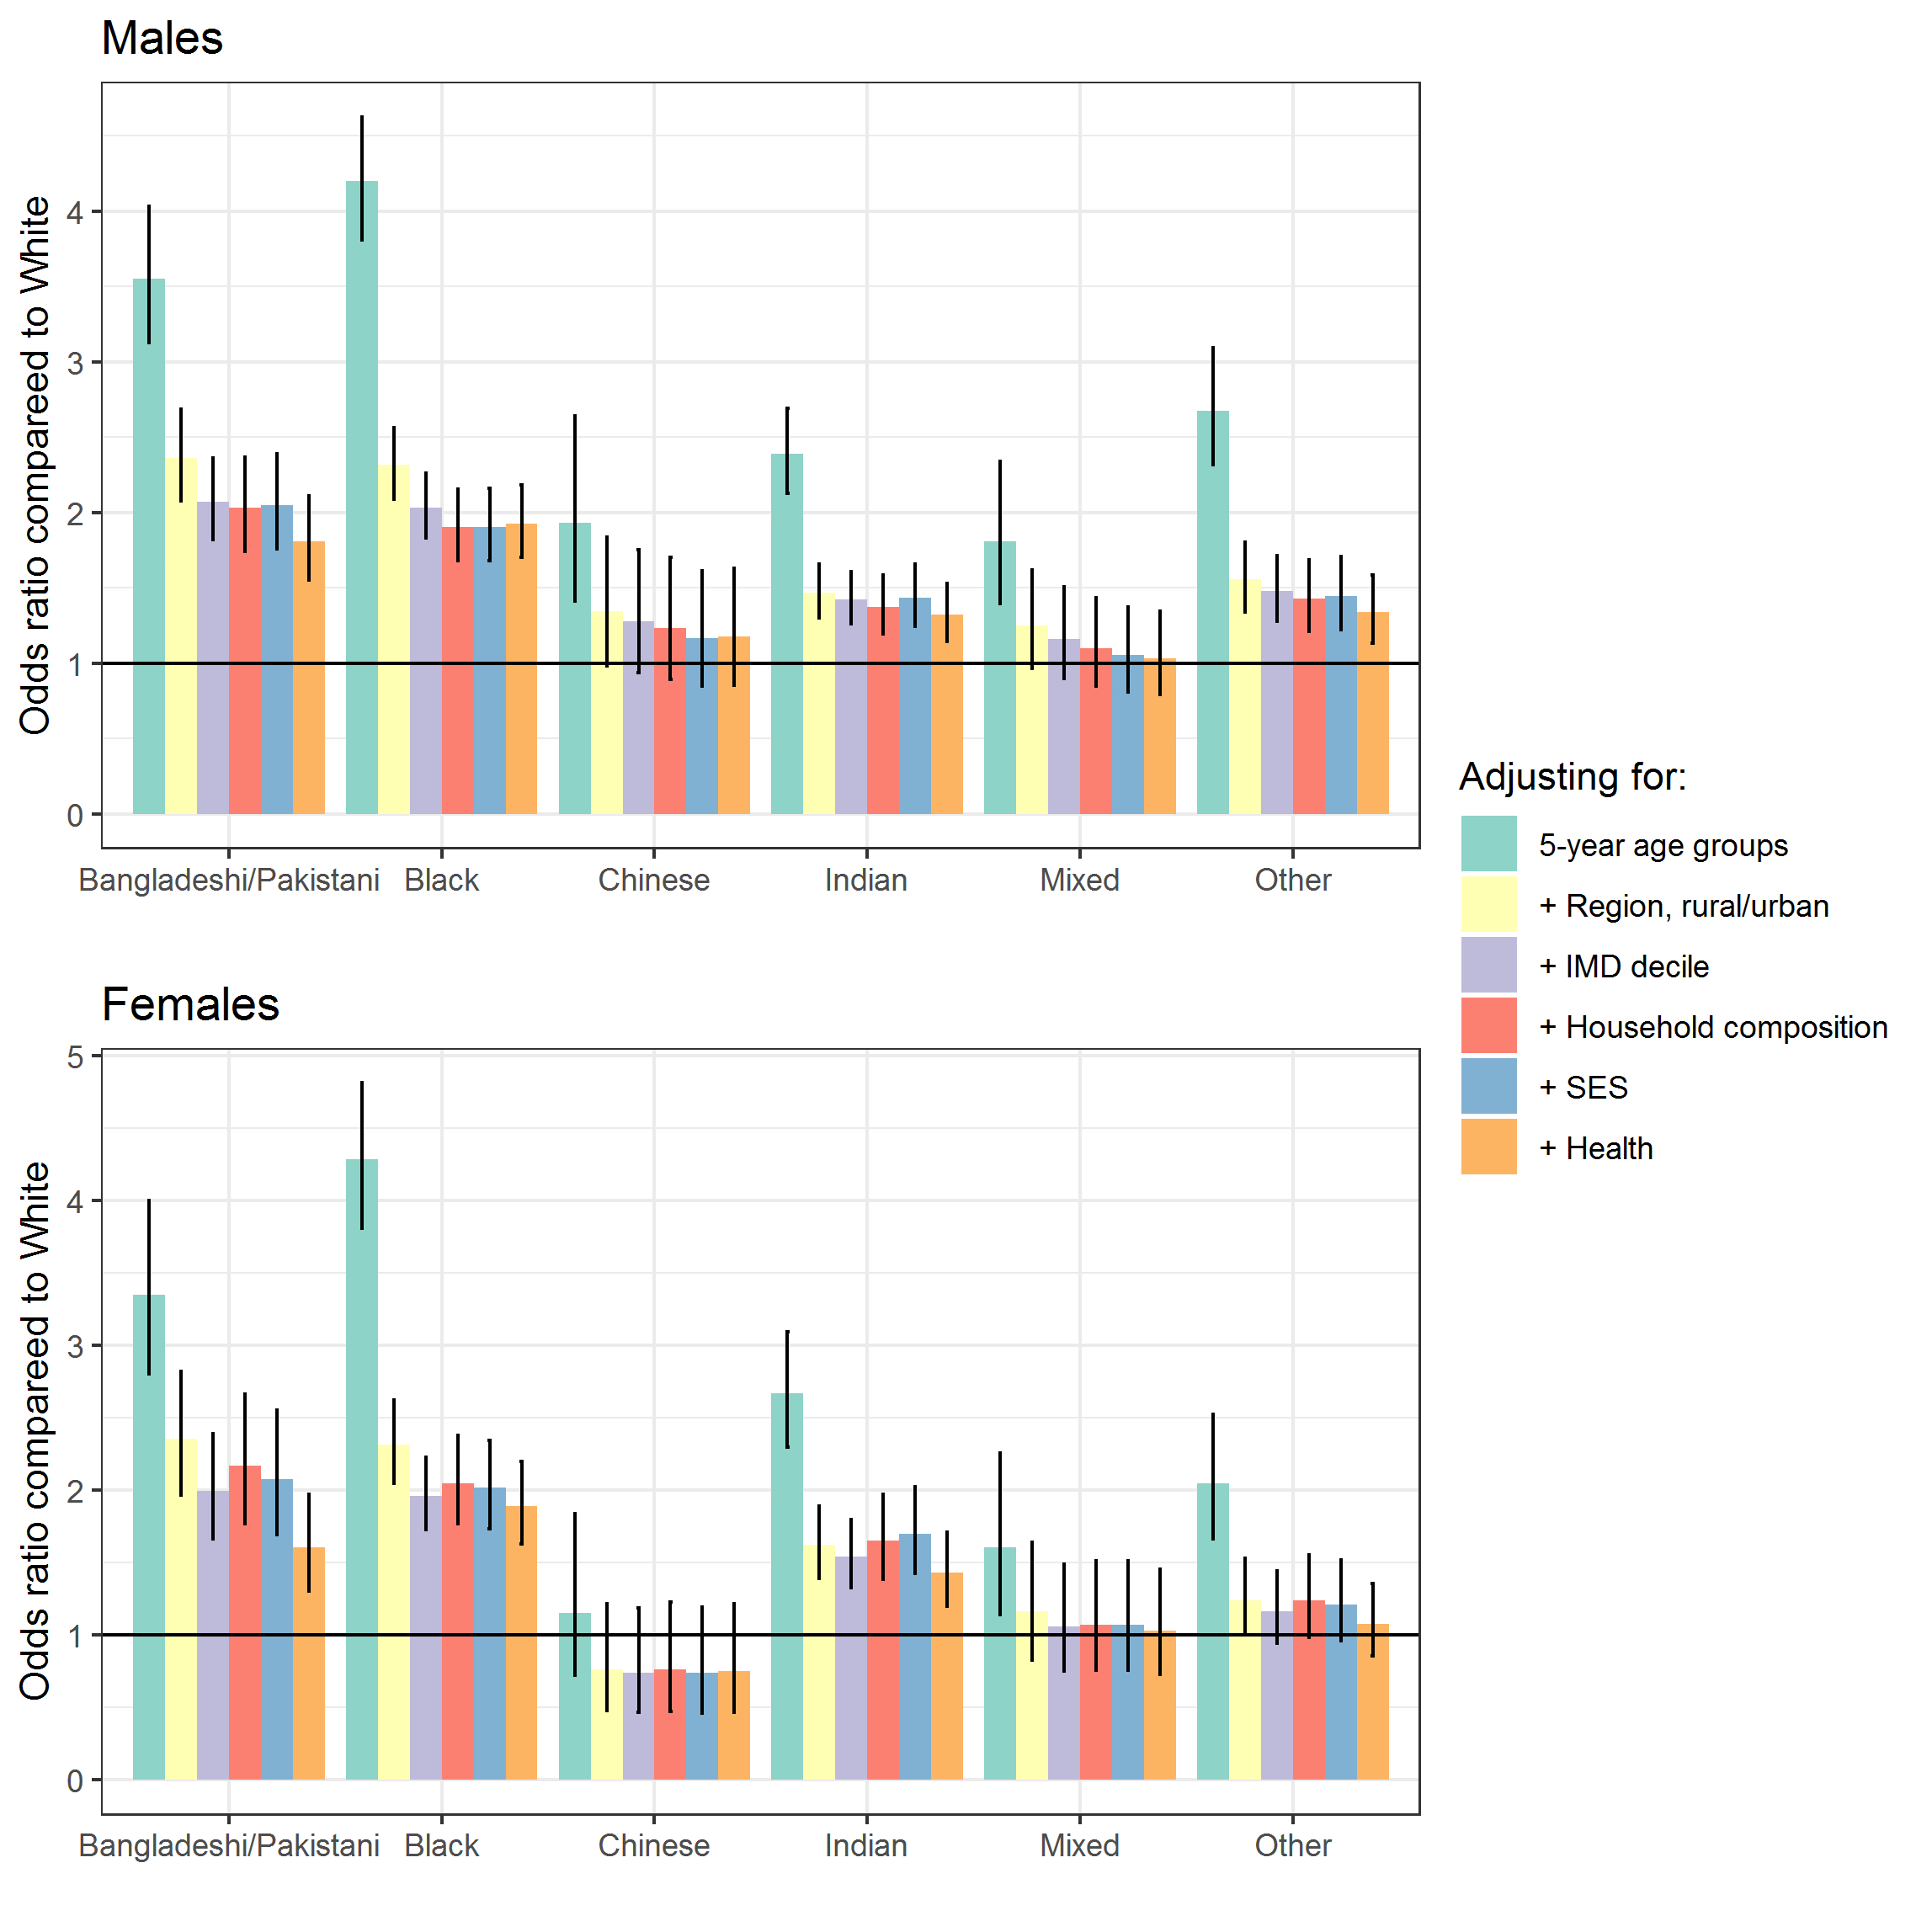
The study attempts to correct for a variety of factors that are known to have a general influence on mortality from Covid-19. If an ethnic group is over-represented at the unfavourable end of the scale for a particular factor (or under-represented at the favourable end) the modelling approach adjusts the mortality measure to account for this. After adjusting for all 6 factors, Blacks had a mortality rate greater than Whites by a factor of 1.93 for males and 1.89 for females. For Bangladeshi/Pakistani people the factors reduce to 1.81 (males) and 1.61 (females). For males the factors decline across the ethnic groups in order Other(1.34), Indian(1.32), Chinese(1.18) and Mixed(1.03). For females it is Indian (1.43), Other(1.08), MIxed(1.03) and Chinese(0.75).
I remain to be convinced about arguments related to occupation type, simply because the White group numerically dominates the statistics. For example, this source (
https://www.ethnicity-facts-figures.ser ... rce/latest ) suggests that whilst Whites are under-represented in the NHS the numbers are still very large at 79.2% of the NHS workforce compared to 85.6% of the working age population. The largest ethnic group from this source is Asian and comprises 10% of the NHS workforce compared to 7.2% of the working age population. Blacks in the same terms are 6.1% of the NHS and 3.4% of the WA population. There are some caveats of course, the working age population is based on the 2011 census (as is much of the ONS study data) whilst the NHS figures are from March 2019. There are, as zico notes,other occupational groups (such as care home workers) that might be important. The ONS technical appendix notes that the Bangladeshi/Pakistani ethnic group is by far the biggest ethnic group in the transport and drivers and operatives standard occupational classification sub-major group, which encompasses bus, coach and taxi drivers and those driving other types of industrial and agricultural vehicles, though takes this observation no further in the analysis (probably because of data limitations).
In terms of Bruncher's remarks, elements of the press and some politicians have jumped on the "4 times as likely" headline. Bruncher himself raised this on Polite Discussions a while ago and received these modelling related responses from ursaminotaur and myself
https://lemonfool.co.uk/viewtopic.php?f ... 60#p318231https://lemonfool.co.uk/viewtopic.php?f ... 60#p318252https://lemonfool.co.uk/viewtopic.php?f ... 80#p318722The suggestion of a differential response across ethnic groups is an interesting one I have not seen elsewhere. The lack of modelling is, I suspect, due to a paucity of data on which to base appropriate models. Other hypotheses are based around Vitamin D, and again from Polite Discussions there is relevant comment here:
https://lemonfool.co.uk/viewtopic.php?f ... 00#p319202and in the following few posts.