Mods, I wasn't sure where to post this, so please move if there is a better candidate forum.
There are various sites (eg TrustNet) which have charting tools that allow you to compare prices of shares, or funds, against each other over time, and online brokers can provide this too. But all the ones I've seen set the point for which the lines are equal - "0% growth", or a nominal starting value like £1000, as the left hand, earlier date. They then give you options of when to set that starting date, mainly in comparison to the present day (days, weeks, months or years ago). Some allow you to alter the end date too.
But this means the graph is rather tied to that particular starting date - alter that, and things can look quite different (eg if one of the prices had a particular peak or trough on that date). If the date for which all the lines converged was today - by far the most likely date you'll be interested in - then one graph would give an easier way to compare them all, without having to switch the starting date all the time - it'd all be on there, without having to change the date, and remember the look of the graph from before.
Selecting the earliest possible starting date does sort of give you this, but I think it's still harder to say "here's what these 2 (or more) funds did over the past year, and what they did over 2 years, and what they did since pre-covid ..." with this than with a chart in which the one date most likely to be always used is the date at which everything is level, ie today's value.
Is there any site, or broker, which gives you the option of looking at a chart like this?
Got a credit card? use our Credit Card & Finance Calculators
Thanks to Wasron,jfgw,Rhyd6,eyeball08,Wondergirly, for Donating to support the site
Do any sites show charts with values shown equal in the present?
-
EthicsGradient
- Lemon Slice
- Posts: 584
- Joined: March 1st, 2019, 11:33 am
- Has thanked: 33 times
- Been thanked: 235 times
-
Gerry557
- Lemon Quarter
- Posts: 2057
- Joined: September 2nd, 2019, 10:23 am
- Has thanked: 173 times
- Been thanked: 569 times
Re: Do any sites show charts with values shown equal in the present?
Unfortunately I've not come across any.
-
jaizan
- Lemon Slice
- Posts: 403
- Joined: September 1st, 2018, 10:21 pm
- Has thanked: 228 times
- Been thanked: 116 times
Re: Do any sites show charts with values shown equal in the present?
I'm not aware of it, but you can get historic price data for multiple stocks in google sheets.
So charts with equal current value could be created in google or excel.
So charts with equal current value could be created in google or excel.
-
Gilgongo
- Lemon Slice
- Posts: 420
- Joined: November 5th, 2016, 6:51 pm
- Has thanked: 157 times
- Been thanked: 127 times
Re: Do any sites show charts with values shown equal in the present?
As @jaizan says, you could do this with a Google Sheets chart (if I understand you correctly).
So to create a chart to compare two past share prices from today (perhaps yesterday might be more reliable, not tried it) and back say, 180 days, create columns for the dates with the following (where n is a number incrementing down from 180):
Then two columns for each share containing 180 cells each with (where "ticker" is the ticker and again "n" is the number of days in the past starting with 1):
Then use the insert chart function to display the chart from those columns.
So to create a chart to compare two past share prices from today (perhaps yesterday might be more reliable, not tried it) and back say, 180 days, create columns for the dates with the following (where n is a number incrementing down from 180):
Code: Select all
=TODAY()-nThen two columns for each share containing 180 cells each with (where "ticker" is the ticker and again "n" is the number of days in the past starting with 1):
Code: Select all
=(GOOGLEFINANCE("ticker","price")-INDEX(GOOGLEFINANCE("ticker","price",today()-n),2,2))/INDEX(GOOGLEFINANCE("ticker","price",today()-n),2,2)Then use the insert chart function to display the chart from those columns.
-
EthicsGradient
- Lemon Slice
- Posts: 584
- Joined: March 1st, 2019, 11:33 am
- Has thanked: 33 times
- Been thanked: 235 times
Re: Do any sites show charts with values shown equal in the present?
Thanks, @jaizan and @Gilgongo, I'll play with those. I can get some results with ITs and ETFs, but it looks like OEICs need more work - Google Finance has data for US and Indian mutual funds, but not, it seems, anything equivalent for the UK. I can see old Lemon Fool threads scraping data with functions like importhtml() and Morningstar data - I'll see what can be done.
It would seem a worthwhile way for sites to show their data, anyway.
It would seem a worthwhile way for sites to show their data, anyway.
-
1nvest
- Lemon Quarter
- Posts: 4458
- Joined: May 31st, 2019, 7:55 pm
- Has thanked: 701 times
- Been thanked: 1374 times
Re: Do any sites show charts with values shown equal in the present?
You seemingly need less of a chart, more of a measure, such as log linear regression (trend line slope). From a series of yearly (total accumulation return progression (1, 1.1, 1.21, 1.3 ..etc) something like linest(ln(B1:B20))-1 ... and the one with the larger/faster total return growth trend is more reflective of having been 'better', rather than measuring between individual start/end points where selective choices of those individual points might make the generally worse of the two seem to have been better (which it was but only for those two specific start/end dates).
-
vand
- Lemon Slice
- Posts: 758
- Joined: January 5th, 2022, 9:00 am
- Has thanked: 174 times
- Been thanked: 350 times
Re: Do any sites show charts with values shown equal in the present?
I don't think you can do 2 prices on the same chart this way, but you can certainly do it for a single price on TradingView if you divide the symbol by the current price so that it the current price is 1.0.
so eg for FTSE 100 you would do FTSE 100/7554 to reprice current price to 1.0, then historic prices are scaled back off this 1.0 number
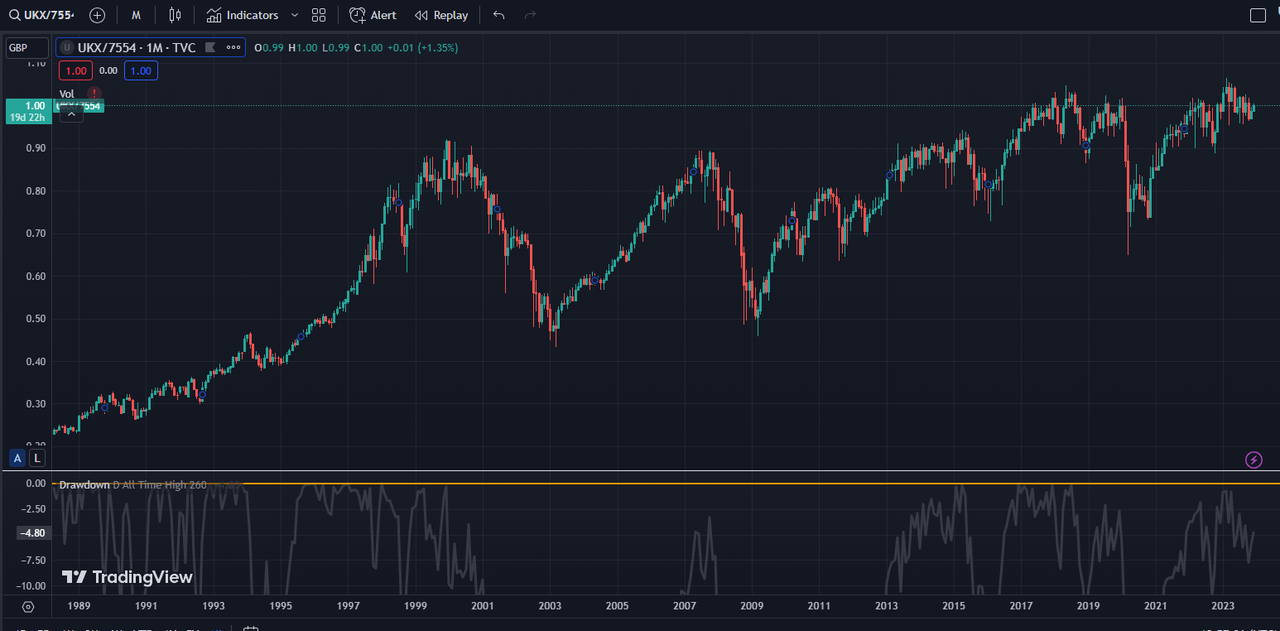
so eg for FTSE 100 you would do FTSE 100/7554 to reprice current price to 1.0, then historic prices are scaled back off this 1.0 number
Re: Do any sites show charts with values shown equal in the present?
Some brokers let you set the baseline to today's value, which makes comparing way less of a headache. Check out different platforms and see which ones offer that option.
Who is online
Users browsing this forum: No registered users and 27 guests