The Growth Ten: 2006-19
Posted: January 19th, 2020, 7:52 pm
The Growth Ten (G10) was an accident. I intended to create only a rough-and-ready yardstick for UK investment trusts which concentrated on capital gain: following the biggest generalists as they were at the turn of the millennium, mostly old stagers already.
I was not out to plug them. But it transpired on jobbing back to 2000 that a portfolio invested with equal amounts would have fared quite well, despite their dim reputation. So I began to treat the Ten as a tool for timorous wealth-builders, reporting on progress at The Motley Fool. Here is a quick update for the past four years.
Constituents:
Aberforth Smaller Companies (ASL)
Alliance (ATST)
BMO Global Smaller Companies (BGSC)*
F&C (FCIT)+
Law Debenture (LWDB)
Monks (MNKS)
Scottish (SCIN)
Scottish American (SAIN, prev. SCAM)
Scottish Mortgage (SMT)
Witan (WTAN)
* formerly F&C Global Smaller Companies (FCS)
+ formerly Foreign & Colonial (FRCL)
The G10 is for long-term holders who wish to accumulate without too much speculating. Most members focus on larger and more developed foreign markets, though not necessarily on the biggest and staidest companies therein; Scottish Mortgage and to a lesser extent Monks relish whizzy 'disruptors'. Besides there is a British specialist in smaller issues, Aberforth, and an overseas counterpart, BMO Global Smaller Companies.
One mainstream op, Law Debenture, has a trading arm. The broadest based ITs, Alliance, F&C, Scottish and Witan, together hold hundreds of positions. Alliance and Witan are funds of funds, cracking the whip over subcontracted managers. F&C and Scottish are do-it-yourselfers. Scottish American stresses dividend as well as asset growth more than the rest.
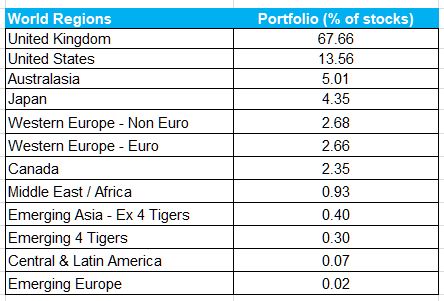
I have no idea how this olla podrida breaks down between countries, sectors or market cap size, or how it stands up against a world equity index. Nor do I care. Doubtless Wall Street, FAANGs, global brands and consumer staples play big parts. I leave the mostly sobersided folks who run such portfolios to their job. The 'Doris' principle of picking a spread and leaving it be applies here as with income baskets. No fooling around with rebalancing after purchase either.
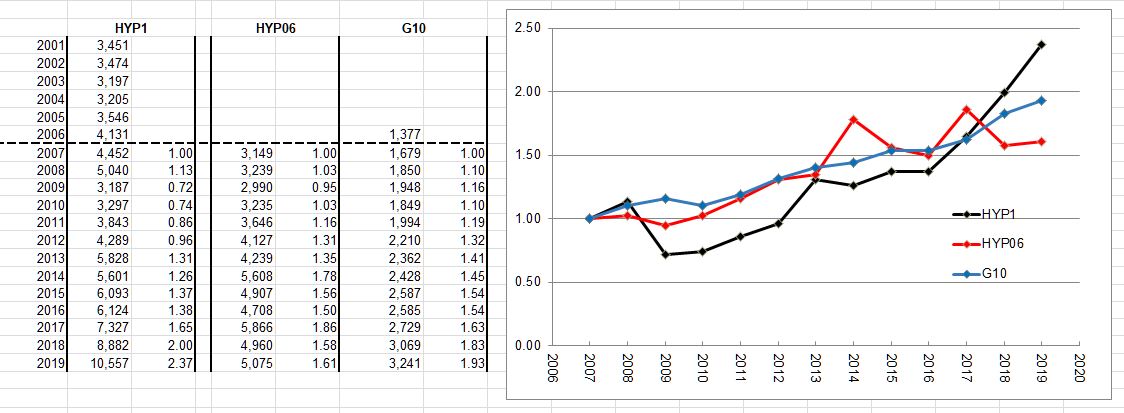
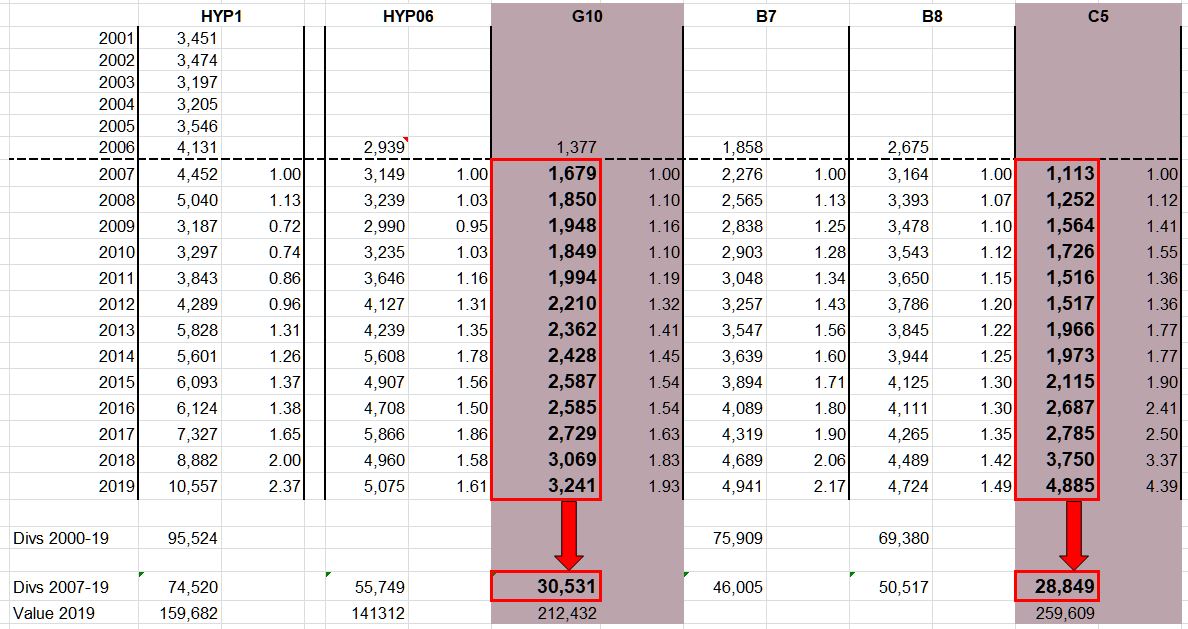
Results to the calendar year end are comparable with those of my imaginary 'HYP06' High Yield Portfolio (see the Jan. 6 post on the HYP Practical board). They arise from the same £75,000 gross outlay-- £7,500 per trust-- on the same start date of Jan. 13, 2006. Below are values; percentage changes year by year; real change deflated by the Retail Prices Index/performance against the FT All Share Index in percentage points, where a minus value is underperformance.
CAPITAL (at Dec. 31)
2006: £81,604, +8.8, +4.4/-2.5
2007: £85,190, +4.4, +0.4/2.4
2008: £56,446, -33.7, -34.6/-1.0
2009: £72,365, +28.2, +25.8/1.2
2010: £90,109, +24.5, +19.7/11.6
2011: £80,336, -10.5, -15.6/-4.2
2012: £93,149, +15.9, +12.8/7.7
2013: £119,650, +28.4, +25.7/11.8
2014: £123,560, +3.3, +1.7/3.4
2015: £137,020, +5.8, +4.6/8.3
2016: £154,392, +18.1, +15.6/5.7
2017: £187,067, +21.2, +17.1/12.2
2018: £173,543, -7.2, -9.9/5.7
2019: £212,432, +22.4, +20./ 8.2
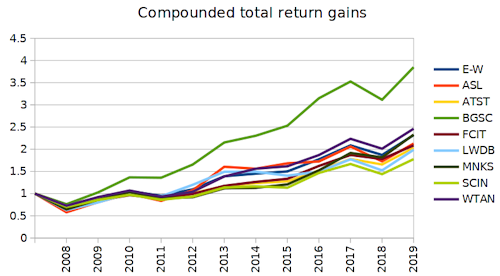
The G10 topped £200,000 for the first time in 2019, close to tripling its investment. It outperformed the All-Share Index by an average 5.7 percentage points pa on share price, by a cumulative 74% and in 11 of 14 years, including the past eight. The latest outperformance, of 8.2 points, was below 2017's record but above the whole-life average equalled in 2016 and 2018.
The compound annual growth rate between inception and Dec. 31 was 8.7% pa or c. 5.7% pa in real terms. The Basket of Seven achieved about 2% real. (It has thrived less since 2005 than in the prior reaction against the tech boom, whereas the G10 had got some fingers burned by internet mania.)
The FE Trustnet Risk Score for the Ten is 110 (skewed by SMT's 185), for the Seven 99. The FTSE 100 is the benchmark here on 100 where cash is 0. So the G10 is reasonably non-volatile, although it lost one-third of its worth in the darkest year of the global crisis and would be less cushioned by dividends in any general slump. For now, figures reflect the superior economics of much of the world beyond the UK and the weakness of its currency. Gearing in trusts helped modestly, given money's cheapness, although debt is usually under one-tenth of net assets.
The average discount of 4.3% at financial year ends in 2018-19 is below the 7% of 2000-19. It shrank by half a point from 2017-18. The tightest discount was 2.7% in 2015-16,after languishing in double figures for most of the previous 15 years. Then it was the fashion to predict extinction at the hands of voracious pension funds for big, boring global ITs. Such talk seems to have died out.
INCOME
This is a minor consideration. Scottish American is the only member with a HYP-sized yield, overlapping Murray International (MYI) in the B7 in that way. Monks pays almost nothing by design. Scottish Mortgage has downplayed the payout as it goes more and more for futurological punts.
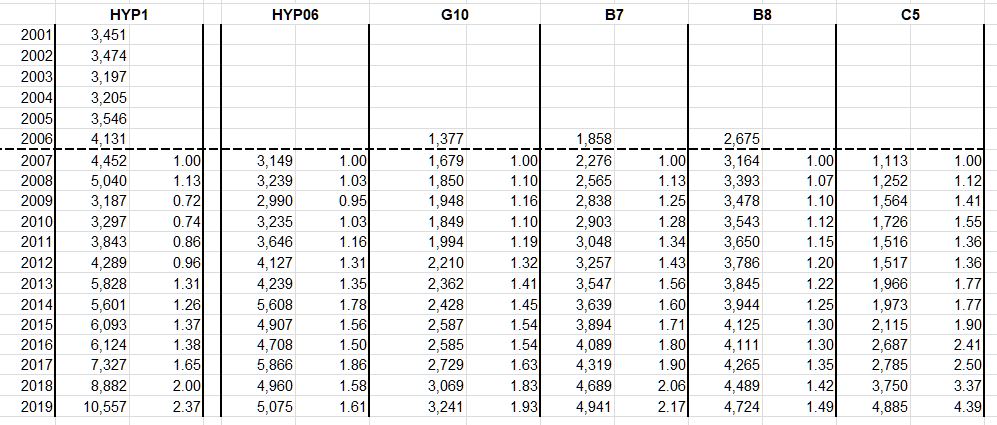
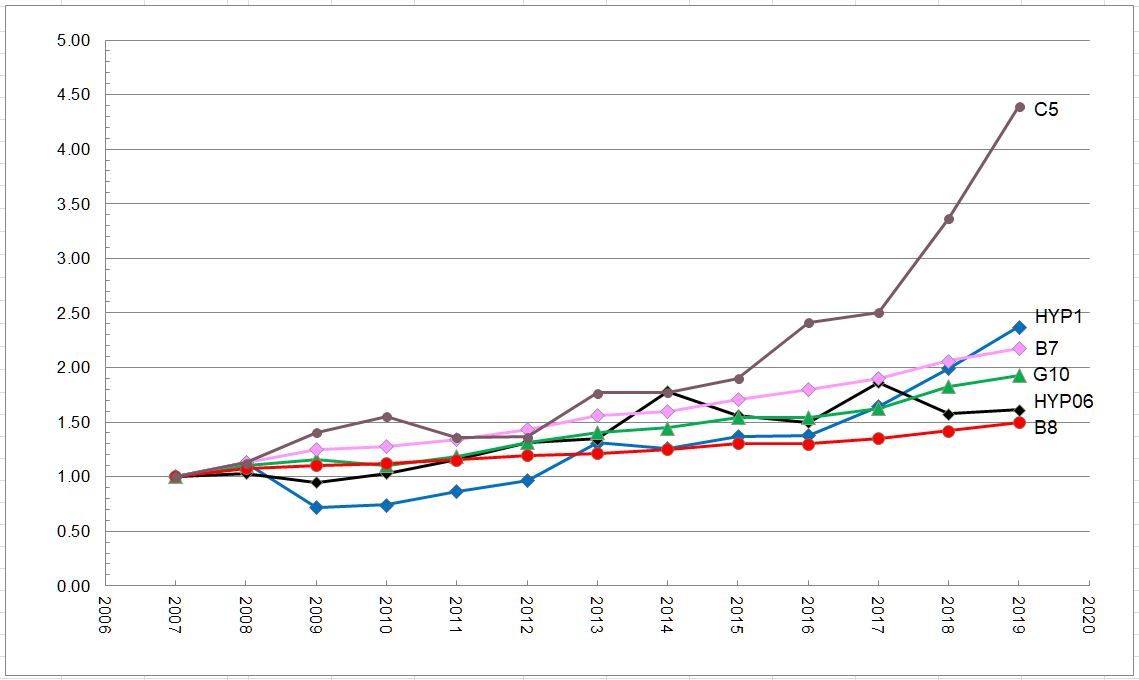
Others have moved to quarterly distributions and begun to emphasise them more, perhaps responding to the retail-investor Zeitgeist, but that is relative: typically the G10 yields less than half the All-Share Index and far less than the Baskets of Seven or Eight. However, income growth has been spirited and can be treated as a reward en passant for patience.
Actual amounts produced including specials, plus nominal and real percentage changes each year:
2006: £1,377
2007: £1,679, +21.9, +17.9
2008: £1,850, +10.2, +9.3
2009: £1.948, +5.3, +2.9
2010: £1.849, -5.0, -9.8
2011: £1,994, +7.8, +3.0
2012: £2,210, +10.8, +7.7
2013: £2,362, +6.9, +4.2
2014: £2,428, +2.8, +1.2
2015: £2,587, +6.6, +5.4
2016: £2,585, -0.1, -2.6
2017: £2,729, +5.5, +1.4
2018: £3,069, +12.5, +9.8
2019: £3,241, +5.6, +3.4
The Growth Ten has disbursed £31,907 on a capital of £75,000, compared with £47,863 from the 'growth-of-income' B7. The latter's receipts never suffered a real decline between years, whereas the G10's fell in 2010 and less seriously in 2016 (1). But latest annual valuations put the G10 two-fifths ahead. Its combined cumulative return is £169,339, one-third more than the basket's £124,168.
Last year the Ten lifted dividends by 5.6%, or by 3.4% after inflation. This was below the average real rise of 4% pa (7% before inflation) over 13 years. Dividends in 2006-19 compounded at 6.8% pa nominal versus the B7's 7.8% from a much larger first-year haul.
The tradeoff with capital is obvious. Moreover, by keeping higher cover the Ten hold back more earnings for recycling, suitably for individual squirrellers. And G10 income remains parsimoniously dispensed: cover for payouts averaged 1.17 times in latest financial years, above the average this century of 1.10 times.
The aggregate revenue reserve has averaged 25 months of current payout since 2000, and has stayed near that ample level recently. Many income ITs get by on half as much. These stats give reason to think revenue will go on outpacing baskets' and buttressing ratings-- together with an inclination by governments such as Japan's and India's to encourage disbursement of corporate earnings.
Ongoing Charges Ratios vary a lot, but the trend is down. Averaging 0.9% this century, they were 0.64% in 2018-19, assisted by rising values but also by the need to compete against open-ended funds. SMT is notably cheap at 0.35%; Aberforth with its elaborate and academic research technique rather dear at 1.2%.
CONSTITUENTS
Briefly, individual trusts' contributions: share price change since launch; number of financial years share price trailed the index and average year-end discount or (premium) during past decade/Risk Score:
ASL: +132.1, 3, 11.5/138
ATST: +141.7, 1, 11.2/108
BGSC: +277.5, 1, 2.0/119
FCIT: +192.7, 2, 8.7/113
LWDB: +117.0, 3, (4.3)*/123
MNKS: +244.3, 3, 7.7/127
SAIN: +86.8, 4, (1.8)/113
SCIN: +92.6, 2, 12.4/99
SMT: +370.6, 3, 3.6/85
WTAN: +177.1, 1, 7.0/105
------------------------------------
G10: +183.2, 1, 6.7/110
* Magnified by overheads of fiduciary businesses
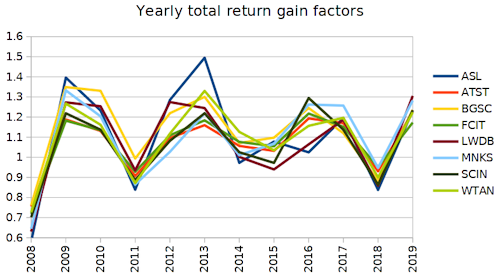
The most valuable member-- with eight wins in a row out of thirteen Dec. year ends before 2019-- has been BMO Smaller Companies. Four blue ribands went to Scottish Mortgage. The bottom marker most often was Scottish, nine times... of which eight were in 2012-19. What's that I hear about inevitable reversion to the mean?
No corporate actions would have required a response from a G10 owner since 2006. Boris rampages on, Doris sleeps on.
----------------------------------------------------------------------------------------------------------------------
(1) FWIW, income could have been 'derisked' to provide an initial spendable withdrawal rate of 1.5% pa-- rising to 2.54% with inflation protection, in three increments by 2015. Holding back that much, one-tenth of the inflow, would have filled a reserve presently worth 14 months'' indexed spendable income. The B7 accommodates 4.3%+RPI with 13 months' worth. However the G10 is not tasked to pay regular bills.
I was not out to plug them. But it transpired on jobbing back to 2000 that a portfolio invested with equal amounts would have fared quite well, despite their dim reputation. So I began to treat the Ten as a tool for timorous wealth-builders, reporting on progress at The Motley Fool. Here is a quick update for the past four years.
Constituents:
Aberforth Smaller Companies (ASL)
Alliance (ATST)
BMO Global Smaller Companies (BGSC)*
F&C (FCIT)+
Law Debenture (LWDB)
Monks (MNKS)
Scottish (SCIN)
Scottish American (SAIN, prev. SCAM)
Scottish Mortgage (SMT)
Witan (WTAN)
* formerly F&C Global Smaller Companies (FCS)
+ formerly Foreign & Colonial (FRCL)
The G10 is for long-term holders who wish to accumulate without too much speculating. Most members focus on larger and more developed foreign markets, though not necessarily on the biggest and staidest companies therein; Scottish Mortgage and to a lesser extent Monks relish whizzy 'disruptors'. Besides there is a British specialist in smaller issues, Aberforth, and an overseas counterpart, BMO Global Smaller Companies.
One mainstream op, Law Debenture, has a trading arm. The broadest based ITs, Alliance, F&C, Scottish and Witan, together hold hundreds of positions. Alliance and Witan are funds of funds, cracking the whip over subcontracted managers. F&C and Scottish are do-it-yourselfers. Scottish American stresses dividend as well as asset growth more than the rest.
I have no idea how this olla podrida breaks down between countries, sectors or market cap size, or how it stands up against a world equity index. Nor do I care. Doubtless Wall Street, FAANGs, global brands and consumer staples play big parts. I leave the mostly sobersided folks who run such portfolios to their job. The 'Doris' principle of picking a spread and leaving it be applies here as with income baskets. No fooling around with rebalancing after purchase either.
Results to the calendar year end are comparable with those of my imaginary 'HYP06' High Yield Portfolio (see the Jan. 6 post on the HYP Practical board). They arise from the same £75,000 gross outlay-- £7,500 per trust-- on the same start date of Jan. 13, 2006. Below are values; percentage changes year by year; real change deflated by the Retail Prices Index/performance against the FT All Share Index in percentage points, where a minus value is underperformance.
CAPITAL (at Dec. 31)
2006: £81,604, +8.8, +4.4/-2.5
2007: £85,190, +4.4, +0.4/2.4
2008: £56,446, -33.7, -34.6/-1.0
2009: £72,365, +28.2, +25.8/1.2
2010: £90,109, +24.5, +19.7/11.6
2011: £80,336, -10.5, -15.6/-4.2
2012: £93,149, +15.9, +12.8/7.7
2013: £119,650, +28.4, +25.7/11.8
2014: £123,560, +3.3, +1.7/3.4
2015: £137,020, +5.8, +4.6/8.3
2016: £154,392, +18.1, +15.6/5.7
2017: £187,067, +21.2, +17.1/12.2
2018: £173,543, -7.2, -9.9/5.7
2019: £212,432, +22.4, +20./ 8.2
The G10 topped £200,000 for the first time in 2019, close to tripling its investment. It outperformed the All-Share Index by an average 5.7 percentage points pa on share price, by a cumulative 74% and in 11 of 14 years, including the past eight. The latest outperformance, of 8.2 points, was below 2017's record but above the whole-life average equalled in 2016 and 2018.
The compound annual growth rate between inception and Dec. 31 was 8.7% pa or c. 5.7% pa in real terms. The Basket of Seven achieved about 2% real. (It has thrived less since 2005 than in the prior reaction against the tech boom, whereas the G10 had got some fingers burned by internet mania.)
The FE Trustnet Risk Score for the Ten is 110 (skewed by SMT's 185), for the Seven 99. The FTSE 100 is the benchmark here on 100 where cash is 0. So the G10 is reasonably non-volatile, although it lost one-third of its worth in the darkest year of the global crisis and would be less cushioned by dividends in any general slump. For now, figures reflect the superior economics of much of the world beyond the UK and the weakness of its currency. Gearing in trusts helped modestly, given money's cheapness, although debt is usually under one-tenth of net assets.
The average discount of 4.3% at financial year ends in 2018-19 is below the 7% of 2000-19. It shrank by half a point from 2017-18. The tightest discount was 2.7% in 2015-16,after languishing in double figures for most of the previous 15 years. Then it was the fashion to predict extinction at the hands of voracious pension funds for big, boring global ITs. Such talk seems to have died out.
INCOME
This is a minor consideration. Scottish American is the only member with a HYP-sized yield, overlapping Murray International (MYI) in the B7 in that way. Monks pays almost nothing by design. Scottish Mortgage has downplayed the payout as it goes more and more for futurological punts.
Others have moved to quarterly distributions and begun to emphasise them more, perhaps responding to the retail-investor Zeitgeist, but that is relative: typically the G10 yields less than half the All-Share Index and far less than the Baskets of Seven or Eight. However, income growth has been spirited and can be treated as a reward en passant for patience.
Actual amounts produced including specials, plus nominal and real percentage changes each year:
2006: £1,377
2007: £1,679, +21.9, +17.9
2008: £1,850, +10.2, +9.3
2009: £1.948, +5.3, +2.9
2010: £1.849, -5.0, -9.8
2011: £1,994, +7.8, +3.0
2012: £2,210, +10.8, +7.7
2013: £2,362, +6.9, +4.2
2014: £2,428, +2.8, +1.2
2015: £2,587, +6.6, +5.4
2016: £2,585, -0.1, -2.6
2017: £2,729, +5.5, +1.4
2018: £3,069, +12.5, +9.8
2019: £3,241, +5.6, +3.4
The Growth Ten has disbursed £31,907 on a capital of £75,000, compared with £47,863 from the 'growth-of-income' B7. The latter's receipts never suffered a real decline between years, whereas the G10's fell in 2010 and less seriously in 2016 (1). But latest annual valuations put the G10 two-fifths ahead. Its combined cumulative return is £169,339, one-third more than the basket's £124,168.
Last year the Ten lifted dividends by 5.6%, or by 3.4% after inflation. This was below the average real rise of 4% pa (7% before inflation) over 13 years. Dividends in 2006-19 compounded at 6.8% pa nominal versus the B7's 7.8% from a much larger first-year haul.
The tradeoff with capital is obvious. Moreover, by keeping higher cover the Ten hold back more earnings for recycling, suitably for individual squirrellers. And G10 income remains parsimoniously dispensed: cover for payouts averaged 1.17 times in latest financial years, above the average this century of 1.10 times.
The aggregate revenue reserve has averaged 25 months of current payout since 2000, and has stayed near that ample level recently. Many income ITs get by on half as much. These stats give reason to think revenue will go on outpacing baskets' and buttressing ratings-- together with an inclination by governments such as Japan's and India's to encourage disbursement of corporate earnings.
Ongoing Charges Ratios vary a lot, but the trend is down. Averaging 0.9% this century, they were 0.64% in 2018-19, assisted by rising values but also by the need to compete against open-ended funds. SMT is notably cheap at 0.35%; Aberforth with its elaborate and academic research technique rather dear at 1.2%.
CONSTITUENTS
Briefly, individual trusts' contributions: share price change since launch; number of financial years share price trailed the index and average year-end discount or (premium) during past decade/Risk Score:
ASL: +132.1, 3, 11.5/138
ATST: +141.7, 1, 11.2/108
BGSC: +277.5, 1, 2.0/119
FCIT: +192.7, 2, 8.7/113
LWDB: +117.0, 3, (4.3)*/123
MNKS: +244.3, 3, 7.7/127
SAIN: +86.8, 4, (1.8)/113
SCIN: +92.6, 2, 12.4/99
SMT: +370.6, 3, 3.6/85
WTAN: +177.1, 1, 7.0/105
------------------------------------
G10: +183.2, 1, 6.7/110
* Magnified by overheads of fiduciary businesses
The most valuable member-- with eight wins in a row out of thirteen Dec. year ends before 2019-- has been BMO Smaller Companies. Four blue ribands went to Scottish Mortgage. The bottom marker most often was Scottish, nine times... of which eight were in 2012-19. What's that I hear about inevitable reversion to the mean?
No corporate actions would have required a response from a G10 owner since 2006. Boris rampages on, Doris sleeps on.
----------------------------------------------------------------------------------------------------------------------
(1) FWIW, income could have been 'derisked' to provide an initial spendable withdrawal rate of 1.5% pa-- rising to 2.54% with inflation protection, in three increments by 2015. Holding back that much, one-tenth of the inflow, would have filled a reserve presently worth 14 months'' indexed spendable income. The B7 accommodates 4.3%+RPI with 13 months' worth. However the G10 is not tasked to pay regular bills.