The Conviction Five: 2006-19
Posted: January 28th, 2020, 9:41 pm
In Dec. 2012 I set up a paper portfolio called the Conviction Five. It was designed, to quote one of its members' professed aims, to preserve wealth and to grow it 'in that order'. Not losing much even in crashes was paramount.
The C5 is for investors who would rather see their pile remain stable than risk returning to Go in pursuit of gorgeous gains. To quote the introductory post 'Wealth Preservers- Through Thick and Thin' on The Motley Fool:
A tracker only spares you from doing worse than your fellows, on average; a 'conviction' investment trust, as they have come to be known, purposes to limit losses when others are losing. It can also take advantage of occasional bouts of optimism to lift that capital to a new plateau, but safety first: Buffett's Law about not losing money is paramount.
(snip)
The conviction brigade is distinguished by method as well as objective. It will try most things. It is loosely pledged, or not at all, to maintain a conventional long-only equity stance or orthodoxy in asset allocation; it roves from type to type as the spirit moves it. Concerned not about looking like other Growth sector trusts-- with which its members are formally classifed-- Conviction follows no benchmark but strives to keep capital safe, come what may. That may prompt either full investment in shares, and a passing resemblance to trusts which liquidate their portfolios little and seldom, or a gallimaufry of bonds (conventional or index-linked), cash, gold bullion, derivatives, stakes in trading businesses... whatever serves the cause of Never (well, hardly ever) Losing Money.
(snip)
I have confined myself to five freewheelers whose portfolios are not too artery-hardened by large long-term holdings in unquoted companies or dynastic shibboleths. They can turn on a sixpence. That is when they are not sitting tight looking down their noses at the lemmings rushing for the entrance or exit in a craze or panic; 'masterly inactivity' is an important facet of the Conviction style, going against the crowd almost axiomatic in running such a fund. Not by coincidence, those who do run them are middle aged or older and have seen nearly all of it before, more than once...
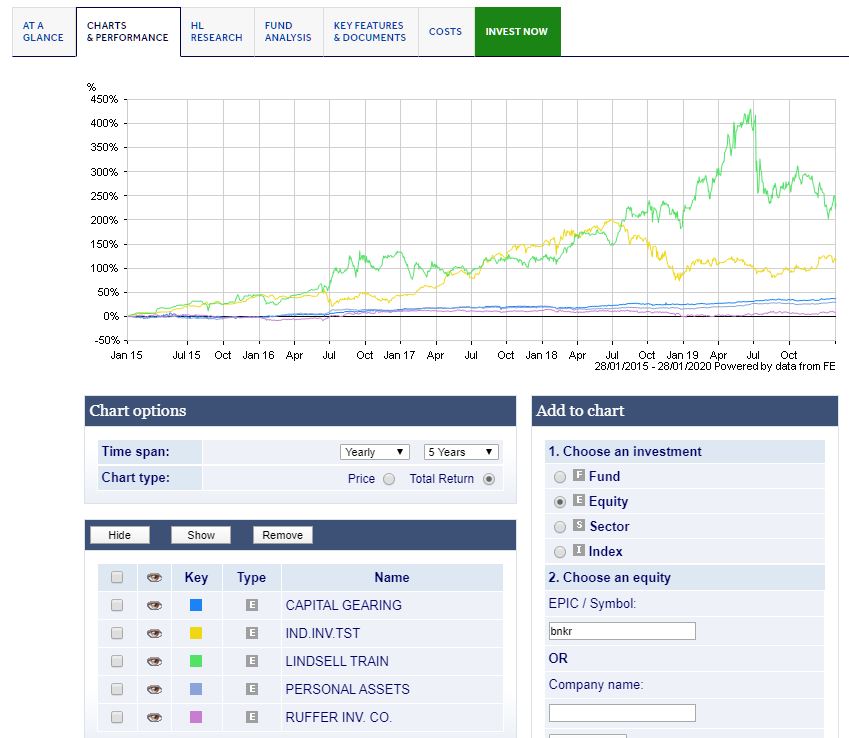
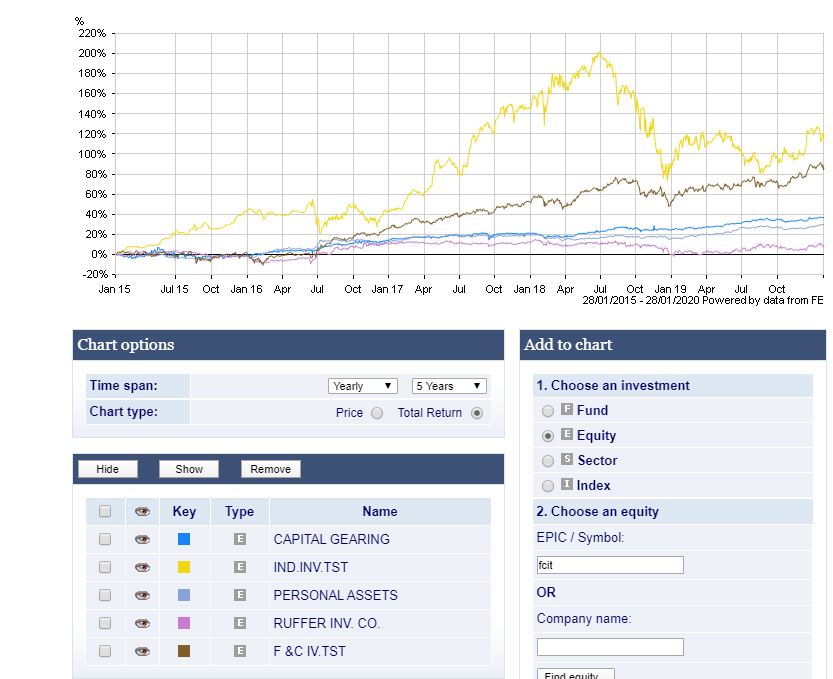
...The five in the spotlight are Capital Gearing (CGT), Independent (IIT), Lindsell Train (LTI), Personal Assets (PNL) and Ruffer (RICA), which last is not a British authorised trust but a Guernsey 'investment company' listed in London (1). All are midsized, dedicated to not losing money and tended by opinionated maestri relaxed about being out of step with conventional wisdom.
The C5 has been calculated back to Jan. 13, 2006, as with my paper High Yield Portfolio, HYP06 and for other investment trust collections, the Growth Ten (G10) and the Baskets of Seven (B7) and Eight (B8). All these assume £75,000 invested before 1% initial costs with apportionment equally to their constituents and no ploughing-back of income. Deflated figures use the Retail Prices Index.
Obviously the models' objectives differ starkly. But to see how widely they diverged in combined return, and how TR splits between bird-in-hand dividends and capital gains, tells us something about the right horse for one's course, as well as reveaing volatility along the 14-year line of march. The period took in a brief spell of calm, a dire, compacted slump in equities and a very long but slow and fitful recovery: contrasting conditions which provided a good workout for a wealth preservationist.
CAPITAL
The Conviction Five's year-end market values; nominal and real percentage changes/performance in percentage points plus or minus versus the FT All-Share Index:
2006: £84,060, +12.1, +7.7/0.8
2007: £76,957, -8.4, -12.4/-10.5
2008: £70,932, -7.8, -5.7/25.0
2009: £88,518, +24.8, +22.4/-0.2
2010: £104,493, +18.0, +17.2/7.1
2011: £104,743, 0.2, -4.6/6.9
2012: £116,310, +11.0, +7.9/2.8
2013: £124,875, +7.4, +4.7/-8.3
2014: £131,970, +5.7, +4.1/7.8
2015: £159,806, +21.1, +19.9/23.6
2016: £208,661, +30.6, +28.1/13.1
2017: £219,673, +5.3, +1.2/-3.7
2018: £243,389, +10.8, +8.1/23.7
2019: £259,609, +6.7, +4.5/-7.5
The C5 increased its deflated value in eleven out of 14 years and beat the index in nine of 14. Its compound annual growth rate (CAGR) was 9.3% pa or 6.7% after inflation. CAGRs for each trust were: CGT, 5.5%; IIT, 6.4%; LTI, 17.4%; PNL, 3.8; RICA, 4.3%.
Resilience was most creditable in the early days. The global financial crisis began to poleaxe share prices in 2007. The portfolio would have fallen by about 8% then and again in 2008, but regained one-quarter in 2009: in real terms, recapturing all lost ground since the end of 2006. There was a further advance of 18% in 2010. Since then the C5 would have ridden the gentler upswing which became the QE silver age for asset prices and the longest modern bull run. The portfolio was higher in nominal worth at each of the past eight New Year's Eves, by at least 5% pa.
Not that this has always been enough to match the All-Share Index: the C5 lagged in 2013, 2017 and 2019. That is relative: as a partially growth-focused enterprise, the C5 is better compared with the Growth Ten, whose worldwide coverage ought to reflect the capitalist world's vivacity more than British-based businesses alone.
Since inception, though as likely to grow in value each twelvemonth, the G10's actual value exceeded the convicts only in 2007, finishing £8,000 ahead. After the V-shaped crash and rapid rally, at end-2009 the C5 was £16,000 ahead and has held the lead ever since.
It topped £100K at end-2010, whereas the G10 did not hit six figures until end-2013. At that point the C5 was only £5,000 in front-- such is the penalty of wealth conservation when prices are exuberant-- but by end-2015, after bullishness had cooled, it led the G10 by £23,000. Again, the bounce last year narrowed its edge from £70,000 to £47,000, but one doubts a cautious holder would have felt very disgruntled.
CONTRIBUTORS
The C5 has evolved as a kind of barbell strategy. At one end, Lindsell Train and Independent have been highly volatile, though tending to grow fastest; at the other, Ruffer, Capital Gearing and especially Personal Assets have been safety-first stabilisers at the expense of growth.
Let us consider the year-end percentage weights at five moments of the portfolio's life: 2007, when the market was beginning to fall; 2009, after the speedy recovery; 2013, following a lesser fit of nerves; 2016, when the charge into LTI began; and 2019, apres bounce and after LTI blew off somewhat:
CGT: 19.1/21.4/18.4/13.0/12.2
IIT: 17.8/12.6/13.5/11.6/13.7
LTI: 24.3/23.2/32.7/50.7/54.0
PNL: 19.7/18.8/15.3/11.2/9.0
RICA: 19.1/24.0/20.2/13.5/10.7
Capital Gearing: Given longtime manager Peter Spiller's multi-asset stance and inflation phobia, it has clung to US index-linked bonds and gold. This served CGT well in the financial crisis but has left it sidelined by the long upswing. Its contribution gradually declined relatively, but it amply fulfilled its enduring objective of never troubling slumbers.
Since 1982-83 net asset value has fallen in real terms in only five of 36 years, with a CAGR of 3.7% real. CGT has never been either the best or worst performer over a calendar year, but was never more than £300 below the original £15K stake at Dec. 31, and is now worth twice as much. It retains almost 200 positions and keeps a grip on the discount through share buybacks and creations.
Independent: Run by Max Ward almost single-handed, and formerly a Scottish rich man's club which seldom encouraged the wider public to dive in, IIT sticks to equities and tries to time cycles and sectors. In this it is the most conventional of the convicts. Often it gets things wrong (e.g. housebuilders and oils in recent times) and apologises. It did not shine either in the slump or for most of what ensued, but has been livelier lately.
IIT was consistently the worst performer until 2014, had a bad 2018 but a better 2019. It is the only constituent which customarily sells at a discount. Despite the erratic contribution, overall it has not been notably stronger or weaker than the three prudent members. But as part of a LTBH collection, it must be deemed my least successful choice.
Lindsell Train: Aims "to maximise long-term total returns with a minimum objective to maintain the real purchasing power of Sterling capital." Not 'arf, as Alan Freeman used to say. This is the C5's star turn, almost absurdly so since c. 2015 when its 24.2% interest in its management company began to smell like a gold mine. Now running over £20bn, mostly in open=ended funds, LT's worth to the eponymous trust is often suspected of being understated.
Michael Lindsell and the trust's manager Nick Train are of the 'growth at a reasonable price' school: they pick moated global brands making hay in expanding consumer markets, then leave the brands' owners to get on with the job. Portfolio churn is snail-like; indifference to macro trends ostentatious; self-criticism, e.g over Pearson, frequent.
Train is vocal against his cult, deploring the wild 100+ per cent premium LTI hit before worries about the group's peripheral connection with the Woodford debacle, by way of its large exposure to Hargreaves Lansdown, took it down below 10%. Train has also been the target of whispers about the succession and the liquidation risks in any Woodford-like run on his OEICs, with their concentrated (but blue-chip) holdings. His rebuttals are here (.pdf):
https://www.lindselltrain.com/~/media/F ... 019_12.pdf
The trust has been the most valuable contributor every year since 2007 except 2008, and was never worth less than at launch.
Personal Assets: The prudent play par excellence, resembling Capital Gearing but even more wary of any upturn in shares driven by helicopter money. Manager Sebastian Lyon of Troy and his supervisors, chairman Hamish Buchan and 'executive director' Robin Angus, shunned the post-2008 stimulus effect and missed a fleet of buses, so that PNL has been the smallest contributor of the five for almost a decade-- now the only one to have drifted below half what its proportionate weight would be.
Buchan and Angus are retiring and Lyon still insists he is keeping his powder dry for a broad move into stocks when, if ever, the weather changes. Meanwhile, PNL was the lightweight of the C5 at each year end since 2014. It observes close discount control.
Ruffer: With a very undemanding benchmark of 2x base rate, Jonathan Ruffer's boys have sounded like PNL in promising that whenever UK equities become cheap enough RICA will be in like Flynn. Meanwhile, it parks in cash, bonds and bullion with only a modicum in shares that are selected on Trainesque principles but come out differently: Disney, Lloyds Bank and Tesco rather than his favoured food, drink and home-entertainment positions.
"We try not to lose money in any 12 month period, and to grow the value of our investors’ wealth over the long haul." RICA held its own as a conservative operation better than PNL until mid-decade, but has been wrong-footed similarly by the Trump renaissance. Its moment of glory was in the depths of end-2018, when it was the highest valued of the C5, having been the cheapest at end-2006: proof of defensiveness. Later it tested neither floor nor ceiling. Its discount is held close to net asset value by issuance or withdrawals.
METRICS
The aggregate of financial results for the composite year to Jun., which best fits different accounting dates, discloses these measures of the C5's robustness: percentage change in deflated net asset value per share; year-end (discount)/premium; expenses as percentage of year-end net asset value:
2006: 8.2, 4.9/1.01
2007: 7.9, 8.0/0.95
2008: -5.3, 2.7/1.01
2009: -5.1, (0.5)/1.11
2010: 23.5, 7.0/1.05
2011: 4.2, 2.4/1.03
2012: 3.8, 3.9/0.95
2013: 9.7, 3.7/1.06
2014: -0.6, 4.2/0.97
2015: 13.3, 3.1/1.03
2016: 6.0, 15.6/0.92
2017: 10.2, 22.2/1.02
2018: 11.1, 24.4/0.94
2019: 11.4, 43.2/0.89
Same metrics by trust, average 2006-19:
CGT: 3.7, 5.0/1.17
IIT: 8.8, (7.7)/0.35
LTI: 13.4, 16.6/1.96
PNL 1.8, 0.9/0.93
RICA: 2.4, 1.4/1.03
Real NAV per share has risen by an average 7.3% pa and in eleven of 14 years, like share prices. The last serious setback was 2009. There has been a purchase premium continually except in the same year, when optimism left safety shots in the locker temporarily; but discount control contained said premium below 10% until Lindsell Trainmania set in four years ago.
Expenses average 1.00% of NAV; they too peaked in 2009, but have tended to be pruned, although the elephantiasis of LTI partly explains why they dipped under 0.9% for the first time last year. 'Conviction', whether or not it means sitting tight and doing nowt, does not come cheap: the Growth Ten's expense ratio was 0.89%.
Some people nurse a psychological inhibition about buying trusts on a premium. The C5's has been nearly 10% during its life. A more practical complaint is that the prices of LTI, PNL and CGT are very heavy, making smaller investments less easy.
VOLATILITY
As mentioned, the portfolio compounded at 9.3% pa, 2006-19. The standard deviation of changes in value between year ends was 10.85. The FE Trustnet Risk Score (measuring volatility in prices over the last three years but weighted towards the present), where cash is 0 and the FTSE 100 index 100, is 233.
For constituents, comparable figures in that order are:
CGT: 5.5/8.50/56
IIT: 6.4/32.54/205
LTI: 17.4/19.65/344 (71 at end-2012!)
PNL: 3.8/7.46/44
RICA: 4.3/9.35/91
Inverse relationships between Risk Score and growth in value are manifest, except that Independent's performance is probably subpar against its volatility: LTI has not only grown far faster but with fewer upsets. The other three are of a piece, albeit Ruffer might have contrived more added value in return for a Risk Score close to the Footsie's.
INCOME
Dividends are even less of a consideration than in the Growth Ten. They are best regarded as a sweetener.
The historic yield averaged c. 1.5%, against c. 2% for the G10, 3.5% for the All-Share and 4% for the universe of 24 income trusts whence my 'baskets' were drawn. Nor (unlike baskets) has any C5 trust committed to a steady rise in paid-out income, nor even to avoiding cuts or freezes. Such policies would compromise the overriding necessity to skirt loss of value, by asking the manager to forage among higher-yielding shares which might well be prone to downgrading on that account.
However, divis and interest do come in, and trusts legally have to shell out 85% of them. Actual outcomes tell a rather different tale from theory; here are nominal and real percentage changes between years and purchasing power indexed to 2006:
2006: £921/100
2007: £1,113, +20.9, +16.9/117
2008: £1,252, +10.7, +9.8/128
2009: £1,564, +26.9, +24.5/160
2010: £1,726,+10.3, +5.5/169
2011: £1,516, -12.2, -17.0/140
2012: £1,517, +0.1, -3.0/136
2013: £1,966, +29.6, +26.9/172
2014: £1,973, +0.4, -1.2/170
2015: £2,115, +7.2, +6.0/180
2016: £2,687, +27.0, +24.5/225
2017: £2,785, +3.6, -0.5/224
2018: £3,750, +34.7, +32.0/295
2019: £4,885, +30.3, +28.1/378
Total £29,749 v. £31,907 for G10. The Conviction Five's CAGR was 13.7%, considerably brisker than its 9.3% for capital and twice as fast as G10 income. It has also grown faster than receipts from the baskets or HYP06. Real falls occurred in four of 13 years, but resulted in inflow never less than 36% above Year 1 in purchasing power.
Income per trust: total, percentage share of total, CAGRs (%):
CGT: £2,015, 6.8, 7.6
IIT: £5,793, 9.5, 7.1
LTI: £13,561, 45.6, 24.3
PNL: £4,381, 14.7, 7.8
RICA: £3,999, 13.4, 4.6
Portfolio total/average: £29,749, 100.0, 13.7
The surge since 2017 is due to the stake in LT's earnings, but given the scale of the business those may be more reliable than dividends from the portfolio... unless savers take against Messrs Lindsell and Train as they did against Barnett and Woodford. That posits a drastic straying from LT's theory, or disillusionment with its results. No such abjuration has happened yet during its 20 years of running other people's money, though a less dramatic rejection (as at the moment) might dent the C5's returns.
CONCLUSION
The Conviction Five are liable to all the perils of a concentrated portfolio: managers running amok or being replaced by less able ones, fashion shifts which leave them behind, too much reliance on one runaway winner. However, the collection would so far have done what it was plotted to do, and would have done so if Lindsell Train had been passed over for any of the five rejects (see note). Its consistency as an entity suggests the mix is all right, if accidentally.
I may adopt this model myself as the outlook for growth-and-income becomes more overcast. It is not only for youngish or middle-aged savers; even oldies may need a lump of capital for a hedonistic twilight in the care home, or 'assisted living'. Ten or twenty years of real growth of 6-7% a year would be what the doctor ordered.
--------------------------------------------------------------------------------------------------------------------------------
(1) The pool from which these were fished included AVI Global Trust (AGT), formerly British Empire; Caledonia Investments (CLDN); Hansa Investment (HAN), formerly Hansa Trust; Manchester & London (MNL); and RIT Capital Partners (RCP). Had a full slate, a Conviction Ten, been bought, it would have grown from £75,000 in Jan. 2006 to £216,000 in Dec. 2019: £44,000 less than for the C5 but less volatile. A broader choice would muffle the Lindsell Train impact but achieve wealth preservation plus, with a real CAGR of 5%.
Another alternative to Lindsell Train is the LT-run Finsbury [FGT], which cleaves to a similar approach without the complication of the management company holding. Finsbury would have risen from 280.25p to 900p in 2006-19, compounding at 8.7% pa-- faster than any C5 member except LTI, and with more income than the other four to boot.
The C5 is for investors who would rather see their pile remain stable than risk returning to Go in pursuit of gorgeous gains. To quote the introductory post 'Wealth Preservers- Through Thick and Thin' on The Motley Fool:
A tracker only spares you from doing worse than your fellows, on average; a 'conviction' investment trust, as they have come to be known, purposes to limit losses when others are losing. It can also take advantage of occasional bouts of optimism to lift that capital to a new plateau, but safety first: Buffett's Law about not losing money is paramount.
(snip)
The conviction brigade is distinguished by method as well as objective. It will try most things. It is loosely pledged, or not at all, to maintain a conventional long-only equity stance or orthodoxy in asset allocation; it roves from type to type as the spirit moves it. Concerned not about looking like other Growth sector trusts-- with which its members are formally classifed-- Conviction follows no benchmark but strives to keep capital safe, come what may. That may prompt either full investment in shares, and a passing resemblance to trusts which liquidate their portfolios little and seldom, or a gallimaufry of bonds (conventional or index-linked), cash, gold bullion, derivatives, stakes in trading businesses... whatever serves the cause of Never (well, hardly ever) Losing Money.
(snip)
I have confined myself to five freewheelers whose portfolios are not too artery-hardened by large long-term holdings in unquoted companies or dynastic shibboleths. They can turn on a sixpence. That is when they are not sitting tight looking down their noses at the lemmings rushing for the entrance or exit in a craze or panic; 'masterly inactivity' is an important facet of the Conviction style, going against the crowd almost axiomatic in running such a fund. Not by coincidence, those who do run them are middle aged or older and have seen nearly all of it before, more than once...
...The five in the spotlight are Capital Gearing (CGT), Independent (IIT), Lindsell Train (LTI), Personal Assets (PNL) and Ruffer (RICA), which last is not a British authorised trust but a Guernsey 'investment company' listed in London (1). All are midsized, dedicated to not losing money and tended by opinionated maestri relaxed about being out of step with conventional wisdom.
The C5 has been calculated back to Jan. 13, 2006, as with my paper High Yield Portfolio, HYP06 and for other investment trust collections, the Growth Ten (G10) and the Baskets of Seven (B7) and Eight (B8). All these assume £75,000 invested before 1% initial costs with apportionment equally to their constituents and no ploughing-back of income. Deflated figures use the Retail Prices Index.
Obviously the models' objectives differ starkly. But to see how widely they diverged in combined return, and how TR splits between bird-in-hand dividends and capital gains, tells us something about the right horse for one's course, as well as reveaing volatility along the 14-year line of march. The period took in a brief spell of calm, a dire, compacted slump in equities and a very long but slow and fitful recovery: contrasting conditions which provided a good workout for a wealth preservationist.
CAPITAL
The Conviction Five's year-end market values; nominal and real percentage changes/performance in percentage points plus or minus versus the FT All-Share Index:
2006: £84,060, +12.1, +7.7/0.8
2007: £76,957, -8.4, -12.4/-10.5
2008: £70,932, -7.8, -5.7/25.0
2009: £88,518, +24.8, +22.4/-0.2
2010: £104,493, +18.0, +17.2/7.1
2011: £104,743, 0.2, -4.6/6.9
2012: £116,310, +11.0, +7.9/2.8
2013: £124,875, +7.4, +4.7/-8.3
2014: £131,970, +5.7, +4.1/7.8
2015: £159,806, +21.1, +19.9/23.6
2016: £208,661, +30.6, +28.1/13.1
2017: £219,673, +5.3, +1.2/-3.7
2018: £243,389, +10.8, +8.1/23.7
2019: £259,609, +6.7, +4.5/-7.5
The C5 increased its deflated value in eleven out of 14 years and beat the index in nine of 14. Its compound annual growth rate (CAGR) was 9.3% pa or 6.7% after inflation. CAGRs for each trust were: CGT, 5.5%; IIT, 6.4%; LTI, 17.4%; PNL, 3.8; RICA, 4.3%.
Resilience was most creditable in the early days. The global financial crisis began to poleaxe share prices in 2007. The portfolio would have fallen by about 8% then and again in 2008, but regained one-quarter in 2009: in real terms, recapturing all lost ground since the end of 2006. There was a further advance of 18% in 2010. Since then the C5 would have ridden the gentler upswing which became the QE silver age for asset prices and the longest modern bull run. The portfolio was higher in nominal worth at each of the past eight New Year's Eves, by at least 5% pa.
Not that this has always been enough to match the All-Share Index: the C5 lagged in 2013, 2017 and 2019. That is relative: as a partially growth-focused enterprise, the C5 is better compared with the Growth Ten, whose worldwide coverage ought to reflect the capitalist world's vivacity more than British-based businesses alone.
Since inception, though as likely to grow in value each twelvemonth, the G10's actual value exceeded the convicts only in 2007, finishing £8,000 ahead. After the V-shaped crash and rapid rally, at end-2009 the C5 was £16,000 ahead and has held the lead ever since.
It topped £100K at end-2010, whereas the G10 did not hit six figures until end-2013. At that point the C5 was only £5,000 in front-- such is the penalty of wealth conservation when prices are exuberant-- but by end-2015, after bullishness had cooled, it led the G10 by £23,000. Again, the bounce last year narrowed its edge from £70,000 to £47,000, but one doubts a cautious holder would have felt very disgruntled.
CONTRIBUTORS
The C5 has evolved as a kind of barbell strategy. At one end, Lindsell Train and Independent have been highly volatile, though tending to grow fastest; at the other, Ruffer, Capital Gearing and especially Personal Assets have been safety-first stabilisers at the expense of growth.
Let us consider the year-end percentage weights at five moments of the portfolio's life: 2007, when the market was beginning to fall; 2009, after the speedy recovery; 2013, following a lesser fit of nerves; 2016, when the charge into LTI began; and 2019, apres bounce and after LTI blew off somewhat:
CGT: 19.1/21.4/18.4/13.0/12.2
IIT: 17.8/12.6/13.5/11.6/13.7
LTI: 24.3/23.2/32.7/50.7/54.0
PNL: 19.7/18.8/15.3/11.2/9.0
RICA: 19.1/24.0/20.2/13.5/10.7
Capital Gearing: Given longtime manager Peter Spiller's multi-asset stance and inflation phobia, it has clung to US index-linked bonds and gold. This served CGT well in the financial crisis but has left it sidelined by the long upswing. Its contribution gradually declined relatively, but it amply fulfilled its enduring objective of never troubling slumbers.
Since 1982-83 net asset value has fallen in real terms in only five of 36 years, with a CAGR of 3.7% real. CGT has never been either the best or worst performer over a calendar year, but was never more than £300 below the original £15K stake at Dec. 31, and is now worth twice as much. It retains almost 200 positions and keeps a grip on the discount through share buybacks and creations.
Independent: Run by Max Ward almost single-handed, and formerly a Scottish rich man's club which seldom encouraged the wider public to dive in, IIT sticks to equities and tries to time cycles and sectors. In this it is the most conventional of the convicts. Often it gets things wrong (e.g. housebuilders and oils in recent times) and apologises. It did not shine either in the slump or for most of what ensued, but has been livelier lately.
IIT was consistently the worst performer until 2014, had a bad 2018 but a better 2019. It is the only constituent which customarily sells at a discount. Despite the erratic contribution, overall it has not been notably stronger or weaker than the three prudent members. But as part of a LTBH collection, it must be deemed my least successful choice.
Lindsell Train: Aims "to maximise long-term total returns with a minimum objective to maintain the real purchasing power of Sterling capital." Not 'arf, as Alan Freeman used to say. This is the C5's star turn, almost absurdly so since c. 2015 when its 24.2% interest in its management company began to smell like a gold mine. Now running over £20bn, mostly in open=ended funds, LT's worth to the eponymous trust is often suspected of being understated.
Michael Lindsell and the trust's manager Nick Train are of the 'growth at a reasonable price' school: they pick moated global brands making hay in expanding consumer markets, then leave the brands' owners to get on with the job. Portfolio churn is snail-like; indifference to macro trends ostentatious; self-criticism, e.g over Pearson, frequent.
Train is vocal against his cult, deploring the wild 100+ per cent premium LTI hit before worries about the group's peripheral connection with the Woodford debacle, by way of its large exposure to Hargreaves Lansdown, took it down below 10%. Train has also been the target of whispers about the succession and the liquidation risks in any Woodford-like run on his OEICs, with their concentrated (but blue-chip) holdings. His rebuttals are here (.pdf):
https://www.lindselltrain.com/~/media/F ... 019_12.pdf
The trust has been the most valuable contributor every year since 2007 except 2008, and was never worth less than at launch.
Personal Assets: The prudent play par excellence, resembling Capital Gearing but even more wary of any upturn in shares driven by helicopter money. Manager Sebastian Lyon of Troy and his supervisors, chairman Hamish Buchan and 'executive director' Robin Angus, shunned the post-2008 stimulus effect and missed a fleet of buses, so that PNL has been the smallest contributor of the five for almost a decade-- now the only one to have drifted below half what its proportionate weight would be.
Buchan and Angus are retiring and Lyon still insists he is keeping his powder dry for a broad move into stocks when, if ever, the weather changes. Meanwhile, PNL was the lightweight of the C5 at each year end since 2014. It observes close discount control.
Ruffer: With a very undemanding benchmark of 2x base rate, Jonathan Ruffer's boys have sounded like PNL in promising that whenever UK equities become cheap enough RICA will be in like Flynn. Meanwhile, it parks in cash, bonds and bullion with only a modicum in shares that are selected on Trainesque principles but come out differently: Disney, Lloyds Bank and Tesco rather than his favoured food, drink and home-entertainment positions.
"We try not to lose money in any 12 month period, and to grow the value of our investors’ wealth over the long haul." RICA held its own as a conservative operation better than PNL until mid-decade, but has been wrong-footed similarly by the Trump renaissance. Its moment of glory was in the depths of end-2018, when it was the highest valued of the C5, having been the cheapest at end-2006: proof of defensiveness. Later it tested neither floor nor ceiling. Its discount is held close to net asset value by issuance or withdrawals.
METRICS
The aggregate of financial results for the composite year to Jun., which best fits different accounting dates, discloses these measures of the C5's robustness: percentage change in deflated net asset value per share; year-end (discount)/premium; expenses as percentage of year-end net asset value:
2006: 8.2, 4.9/1.01
2007: 7.9, 8.0/0.95
2008: -5.3, 2.7/1.01
2009: -5.1, (0.5)/1.11
2010: 23.5, 7.0/1.05
2011: 4.2, 2.4/1.03
2012: 3.8, 3.9/0.95
2013: 9.7, 3.7/1.06
2014: -0.6, 4.2/0.97
2015: 13.3, 3.1/1.03
2016: 6.0, 15.6/0.92
2017: 10.2, 22.2/1.02
2018: 11.1, 24.4/0.94
2019: 11.4, 43.2/0.89
Same metrics by trust, average 2006-19:
CGT: 3.7, 5.0/1.17
IIT: 8.8, (7.7)/0.35
LTI: 13.4, 16.6/1.96
PNL 1.8, 0.9/0.93
RICA: 2.4, 1.4/1.03
Real NAV per share has risen by an average 7.3% pa and in eleven of 14 years, like share prices. The last serious setback was 2009. There has been a purchase premium continually except in the same year, when optimism left safety shots in the locker temporarily; but discount control contained said premium below 10% until Lindsell Trainmania set in four years ago.
Expenses average 1.00% of NAV; they too peaked in 2009, but have tended to be pruned, although the elephantiasis of LTI partly explains why they dipped under 0.9% for the first time last year. 'Conviction', whether or not it means sitting tight and doing nowt, does not come cheap: the Growth Ten's expense ratio was 0.89%.
Some people nurse a psychological inhibition about buying trusts on a premium. The C5's has been nearly 10% during its life. A more practical complaint is that the prices of LTI, PNL and CGT are very heavy, making smaller investments less easy.
VOLATILITY
As mentioned, the portfolio compounded at 9.3% pa, 2006-19. The standard deviation of changes in value between year ends was 10.85. The FE Trustnet Risk Score (measuring volatility in prices over the last three years but weighted towards the present), where cash is 0 and the FTSE 100 index 100, is 233.
For constituents, comparable figures in that order are:
CGT: 5.5/8.50/56
IIT: 6.4/32.54/205
LTI: 17.4/19.65/344 (71 at end-2012!)
PNL: 3.8/7.46/44
RICA: 4.3/9.35/91
Inverse relationships between Risk Score and growth in value are manifest, except that Independent's performance is probably subpar against its volatility: LTI has not only grown far faster but with fewer upsets. The other three are of a piece, albeit Ruffer might have contrived more added value in return for a Risk Score close to the Footsie's.
INCOME
Dividends are even less of a consideration than in the Growth Ten. They are best regarded as a sweetener.
The historic yield averaged c. 1.5%, against c. 2% for the G10, 3.5% for the All-Share and 4% for the universe of 24 income trusts whence my 'baskets' were drawn. Nor (unlike baskets) has any C5 trust committed to a steady rise in paid-out income, nor even to avoiding cuts or freezes. Such policies would compromise the overriding necessity to skirt loss of value, by asking the manager to forage among higher-yielding shares which might well be prone to downgrading on that account.
However, divis and interest do come in, and trusts legally have to shell out 85% of them. Actual outcomes tell a rather different tale from theory; here are nominal and real percentage changes between years and purchasing power indexed to 2006:
2006: £921/100
2007: £1,113, +20.9, +16.9/117
2008: £1,252, +10.7, +9.8/128
2009: £1,564, +26.9, +24.5/160
2010: £1,726,+10.3, +5.5/169
2011: £1,516, -12.2, -17.0/140
2012: £1,517, +0.1, -3.0/136
2013: £1,966, +29.6, +26.9/172
2014: £1,973, +0.4, -1.2/170
2015: £2,115, +7.2, +6.0/180
2016: £2,687, +27.0, +24.5/225
2017: £2,785, +3.6, -0.5/224
2018: £3,750, +34.7, +32.0/295
2019: £4,885, +30.3, +28.1/378
Total £29,749 v. £31,907 for G10. The Conviction Five's CAGR was 13.7%, considerably brisker than its 9.3% for capital and twice as fast as G10 income. It has also grown faster than receipts from the baskets or HYP06. Real falls occurred in four of 13 years, but resulted in inflow never less than 36% above Year 1 in purchasing power.
Income per trust: total, percentage share of total, CAGRs (%):
CGT: £2,015, 6.8, 7.6
IIT: £5,793, 9.5, 7.1
LTI: £13,561, 45.6, 24.3
PNL: £4,381, 14.7, 7.8
RICA: £3,999, 13.4, 4.6
Portfolio total/average: £29,749, 100.0, 13.7
The surge since 2017 is due to the stake in LT's earnings, but given the scale of the business those may be more reliable than dividends from the portfolio... unless savers take against Messrs Lindsell and Train as they did against Barnett and Woodford. That posits a drastic straying from LT's theory, or disillusionment with its results. No such abjuration has happened yet during its 20 years of running other people's money, though a less dramatic rejection (as at the moment) might dent the C5's returns.
CONCLUSION
The Conviction Five are liable to all the perils of a concentrated portfolio: managers running amok or being replaced by less able ones, fashion shifts which leave them behind, too much reliance on one runaway winner. However, the collection would so far have done what it was plotted to do, and would have done so if Lindsell Train had been passed over for any of the five rejects (see note). Its consistency as an entity suggests the mix is all right, if accidentally.
I may adopt this model myself as the outlook for growth-and-income becomes more overcast. It is not only for youngish or middle-aged savers; even oldies may need a lump of capital for a hedonistic twilight in the care home, or 'assisted living'. Ten or twenty years of real growth of 6-7% a year would be what the doctor ordered.
--------------------------------------------------------------------------------------------------------------------------------
(1) The pool from which these were fished included AVI Global Trust (AGT), formerly British Empire; Caledonia Investments (CLDN); Hansa Investment (HAN), formerly Hansa Trust; Manchester & London (MNL); and RIT Capital Partners (RCP). Had a full slate, a Conviction Ten, been bought, it would have grown from £75,000 in Jan. 2006 to £216,000 in Dec. 2019: £44,000 less than for the C5 but less volatile. A broader choice would muffle the Lindsell Train impact but achieve wealth preservation plus, with a real CAGR of 5%.
Another alternative to Lindsell Train is the LT-run Finsbury [FGT], which cleaves to a similar approach without the complication of the management company holding. Finsbury would have risen from 280.25p to 900p in 2006-19, compounding at 8.7% pa-- faster than any C5 member except LTI, and with more income than the other four to boot.