A little bit more on the B7 to B8 comparison....
In column 1, I've listed if the Investment Trust was from the basket of 7 (B7) or from the basket of 8 (B8). For simplicity, I've removed the last digit in column 3 - "Delta SP %" column which indicates the change in share price over the 18 years.
The "winner" is, surprisingly, Mercantile ahead of Bankers.
The biggest changes in share prices over the 18 years are not confined uniquely to B7 or to B8 - as we see EDIN, CTY and IVI creeping in at positions 4 to 6 and BCI from B7 as the dunce at the bottom of the class (although Merchants is trying hard to wear that cap).
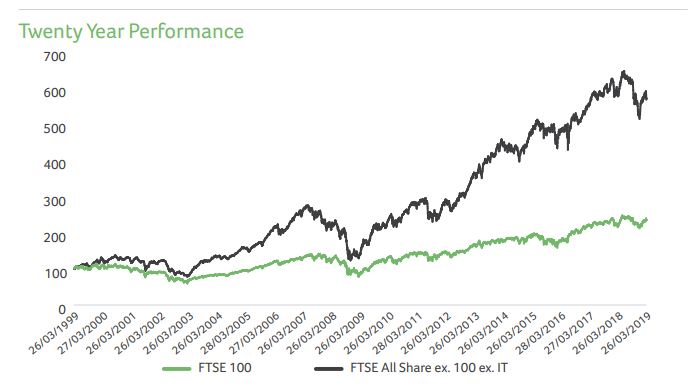
Why has Mercantile done so well? - maybe this is explained in that it invests predominately in medium and smaller companies and not the FTSE100 elephants. I believe (
and I may be wrong here so please correct me if otherwise !) that growth has come from the lower divisions of the FTSE All Share and the big companies have done..not a lot of growing (FTSE100 in year 1999 versus year 2019 ~ 7000-ish).
From their latest Mercantile annual report - freely available on t'internet - here's a link to where it can be downloaded - we see the split between the FTSE100 constituents and the mid caps.
https://am.jpmorgan.com/gb/en/asset-man ... /documents
From the Mercantile annual report we see the way in which the trust has outperformed its benchmark (noting that the benchmark is ex-FTSE100 and ex-IT shares). So, it would appear that the fund is also well run.
 (Back to the baskets!)
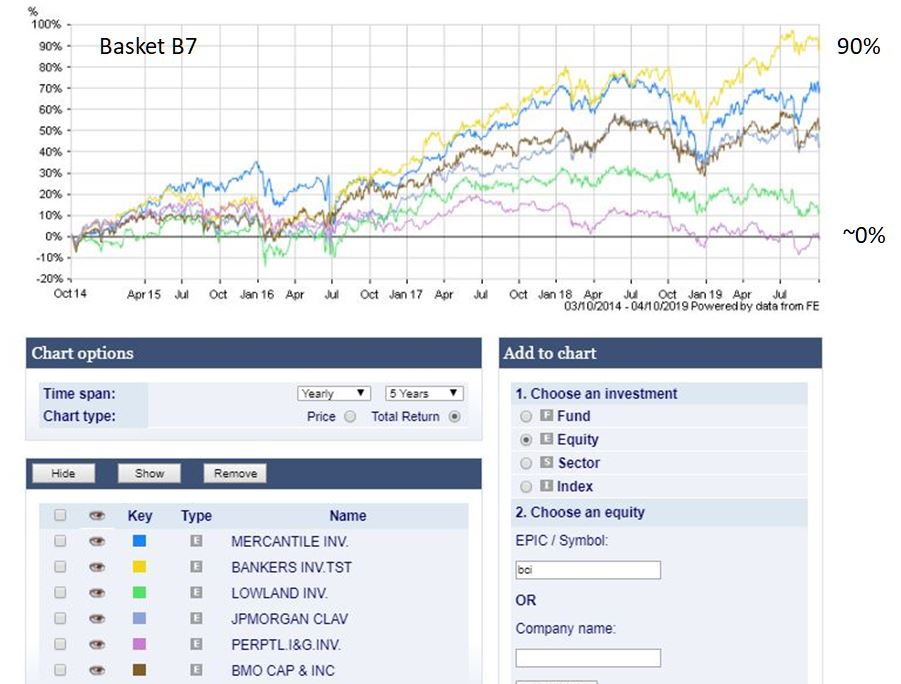
The next two graphs look at the total return of the B7 and B8 funds over the last 5 years (software limitations to 5 years and 7 curves). Which ITs would have yielded the best total return (yes..I like a nice yield but not at the expense of capital)? I reckon 5 years is a reasonable time period which shows up a few things of interest.
First the Basket B7The main observation is that the total returns on the basket constituents have been quite diverse, ranging from superstars Bankers & Mercantile down to sleepy PLI whose report card might read "is lazy, done the bare minimum, expected more from AIC Dividend Heroes member".
(note: graphs created by monabri using Hargreaves Lansdown comparator tool available on the HL website)
 Basket B8
Once again, total returns over the last 5 years. Note Merchants is omitted as the B8 takes 8 curves to show and the software is limited to 7 (but MRCH is actually towards the top end of the B8 family).
The main observation is that the total returns are more tightly banded than the B& family.
 Conclusion & Thoughts(As we are not on the HYP-P board I can mention Total Return (TR) and get away with it
  ...yes. I know, the baskets were for income but not at the expense of capital)
The Total Return investor in me would have been wishing that they'd had gone overweight in the lower yielding Mercantile & the Bankers ITs..(hindsight would be wonderful in that situation). The Total Return investor would have also been surprised at the B7 results in terms of the spread of the B7 results in terms of total return, wishing that it was a "B6" basket with BCI dropped
QuestionsWill UK smaller companies continue to deliver superior returns or will they be 'caught by the Brexits'? Who knows but surely it must be reasonable to include a fund in a basket which contains mid-caps...but should it be a UK-centric fund ?
Will the FTSE100 elephants start to gallop (well, maybe canter a bit) in the near future assuming Brexit is sorted out? The yields on offer and the UK reportedly being good value (
https://www.starcapital.de/en/research/ ... in-charts/) might see a reversal in the tables with the likes of PLI/EDIN benefitting from a revival in the big(ger) capital shares.
Personally, I think that growth will be coming from elsewhere and that it would be wiser to have a spread of investments (via ITs or ETFs) focused on income and growth in other countries and not to have all the eggs in UK baskets.